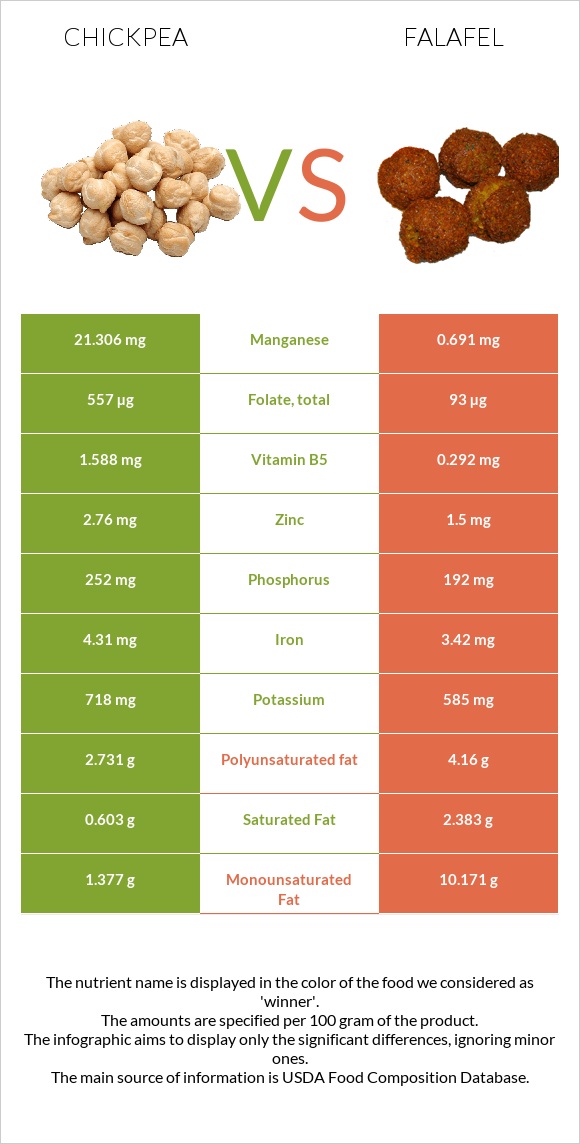
A recap on the differences between chickpeas and falafel Chickpeas are higher in folate, manganese, and copper, yet falafel is higher in potassium, magnesium, vitamin B2, and iron. Chickpeas cover your daily folate needs 20% more than falafel. The amount of saturated fat in chickpeas is lower. Food varieties used in this article are Chickpeas (garbanzo beans, bengal gram), mature seeds, cooked, boiled, without salt and Falafel, home-prepared .
Infographic
Mineral Comparison
Mineral comparison score is based on the number of minerals by which one or the other food is richer. The "coverage" charts below show how much of the daily needs can be covered by 300 grams of the food.
4
100 g
300 g
1 cup - 164g
Magnesium
Magnesium
Calcium
Calcium
Potassium
Potassium
Iron
Iron
Copper
Copper
Zinc
Zinc
Phosphorus
Phosphorus
Sodium
Sodium
Manganese
Manganese
Selenium
Selenium
34%
15%
26%
108%
117%
42%
72%
0.91%
134%
20%
5
100 g
300 g
1 patty (approx 2-1/4" dia) - 17g
Magnesium
Magnesium
Calcium
Calcium
Potassium
Potassium
Iron
Iron
Copper
Copper
Zinc
Zinc
Phosphorus
Phosphorus
Sodium
Sodium
Manganese
Manganese
Selenium
Selenium
59%
16%
52%
128%
86%
41%
82%
38%
90%
5.5%
Vitamin Comparison
Vitamin comparison score is based on the number of vitamins by which one or the other food is richer. The "coverage" charts below show how much of the daily needs can be covered by 300 grams of the food.
4
100 g
300 g
1 cup - 164g
Vitamin C
Vit. C
Vitamin D
Vit. D
Vitamin A
Vit. A
Vitamin E
Vit. E
Vitamin B1
Vit. B1
Vitamin B2
Vit. B2
Vitamin B3
Vit. B3
Vitamin B5
Vit. B5
Vitamin B6
Vit. B6
Vitamin B12
Vit. B12
Vitamin K
Vit. K
Folate
Folate
4.3%
0%
0.33%
7%
29%
15%
9.9%
17%
32%
0%
10%
129%
4
100 g
300 g
1 patty (approx 2-1/4" dia) - 17g
Vitamin C
Vit. C
Vitamin D
Vit. D
Vitamin A
Vit. A
Vitamin E
Vit. E
Vitamin B1
Vit. B1
Vitamin B2
Vit. B2
Vitamin B3
Vit. B3
Vitamin B5
Vit. B5
Vitamin B6
Vit. B6
Vitamin B12
Vit. B12
Vitamin K
Vit. K
Folate
Folate
5.3%
0%
0.33%
0%
37%
38%
20%
18%
29%
0%
0%
70%
All nutrients comparison - raw data values
Nutrient
DV% diff.
Fiber
7.6g
30%
Monounsaturated fat
0.583g
10.171g
24%
Fats
2.59g
17.8g
23%
Folate
172µg
93µg
20%
Polyunsaturated fat
1.156g
4.16g
20%
Manganese
1.03mg
0.691mg
15%
Sodium
7mg
294mg
12%
Copper
0.352mg
0.258mg
10%
Saturated fat
0.269g
2.383g
10%
Protein
8.86g
13.31g
9%
Potassium
291mg
585mg
9%
Calories
164kcal
333kcal
8%
Magnesium
48mg
82mg
8%
Vitamin B2
0.063mg
0.166mg
8%
Choline
42.8mg
8%
Iron
2.89mg
3.42mg
7%
Selenium
3.7µg
1µg
5%
Phosphorus
168mg
192mg
3%
Vitamin B1
0.116mg
0.146mg
3%
Vitamin B3
0.526mg
1.044mg
3%
Vitamin K
4µg
3%
Vitamin E
0.35mg
2%
Carbs
27.42g
31.84g
1%
Calcium
49mg
54mg
1%
Vitamin B6
0.139mg
0.125mg
1%
Protein per 100 calories
5.4g
4g
N/A
Calories per 10 g protein
185kcal
250kcal
N/A
Weight per 100 calories
61g
30g
N/A
Unsaturated / Saturated Fat ratio
6.5
6
N/A
Vitamin C
1.3mg
1.6mg
0%
Net carbs
19.82g
31.84g
N/A
Sugar
4.8g
N/A
Zinc
1.53mg
1.5mg
0%
Vitamin A
1µg
1µg
0%
Vitamin B5
0.286mg
0.292mg
0%
Tryptophan
0.085mg
0.134mg
0%
Threonine
0.329mg
0.492mg
0%
Isoleucine
0.38mg
0.567mg
0%
Leucine
0.631mg
0.944mg
0%
Lysine
0.593mg
0.856mg
0%
Methionine
0.116mg
0.187mg
0%
Phenylalanine
0.475mg
0.707mg
0%
Valine
0.372mg
0.562mg
0%
Histidine
0.244mg
0.364mg
0%
Macronutrient Comparison
Macronutrient breakdown side-by-side comparison
1
9%
3%
27%
60%
Protein:
8.86 g
Fats:
2.59 g
Carbs:
27.42 g
Water:
60.21 g
Other:
0.92 g
4
13%
18%
32%
35%
2%
Protein:
13.31 g
Fats:
17.8 g
Carbs:
31.84 g
Water:
34.62 g
Other:
2.43 g
Contains
more
Water Water
+73.9%
Contains
more
Protein Protein
+50.2%
Contains
more
Fats Fats
+587.3%
Contains
more
Carbs Carbs
+16.1%
Contains
more
Other Other
+164.1%
Fat Type Comparison
Fat type breakdown side-by-side comparison
1
13%
29%
58%
Saturated fat:
Sat. Fat
0.269 g
Monounsaturated fat:
Mono. Fat
0.583 g
Polyunsaturated fat:
Poly. Fat
1.156 g
2
14%
61%
25%
Saturated fat:
Sat. Fat
2.383 g
Monounsaturated fat:
Mono. Fat
10.171 g
Polyunsaturated fat:
Poly. Fat
4.16 g
Contains
less
Sat. Fat Saturated fat
-88.7%
Contains
more
Mono. Fat Monounsaturated fat
+1644.6%
Contains
more
Poly. Fat Polyunsaturated fat
+259.9%