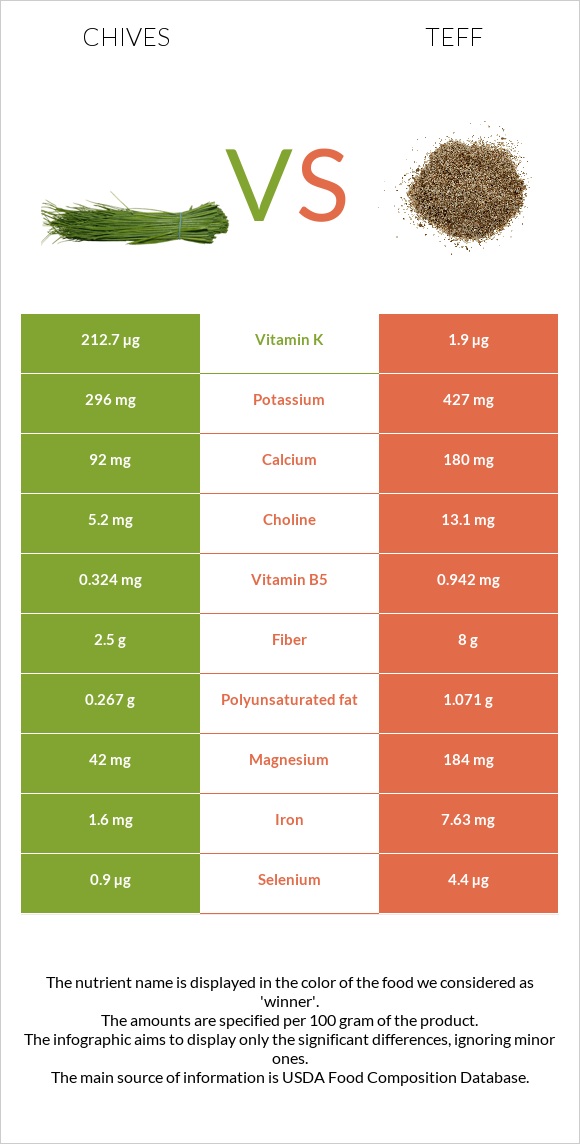
How are chives and teff different? Chives are higher in vitamin A, folate, vitamin B2, and potassium; however, teff is richer in manganese, phosphorus, vitamin B1, copper, and iron. Daily need coverage for manganese for teff is 108% higher. Chives contain 2177 times more vitamin A than teff. While chives contain 4353 IU of vitamin A, teff contains only 2 IU. Chives have a lower glycemic index (45) than teff (57). Chives, raw and Teff, cooked are the varieties used in this article.
Infographic
Mineral Comparison
Mineral comparison score is based on the number of minerals by which one or the other food is richer. The "coverage" charts below show how much of the daily needs can be covered by 300 grams of the food.
4
100 g
300 g
1 tsp chopped - 1g 1 tbsp chopped - 3g
Magnesium
Magnesium
Calcium
Calcium
Potassium
Potassium
Iron
Iron
Copper
Copper
Zinc
Zinc
Phosphorus
Phosphorus
Sodium
Sodium
Manganese
Manganese
Selenium
Selenium
30%
28%
26%
60%
52%
15%
25%
0.39%
49%
4.9%
6
100 g
300 g
1 cup - 252g
Magnesium
Magnesium
Calcium
Calcium
Potassium
Potassium
Iron
Iron
Copper
Copper
Zinc
Zinc
Phosphorus
Phosphorus
Sodium
Sodium
Manganese
Manganese
Selenium
Selenium
36%
15%
9.4%
77%
75%
30%
51%
1%
373%
0%
Vitamin Comparison
Vitamin comparison score is based on the number of vitamins by which one or the other food is richer. The "coverage" charts below show how much of the daily needs can be covered by 300 grams of the food.
8
100 g
300 g
1 tsp chopped - 1g 1 tbsp chopped - 3g
Vitamin C
Vit. C
Vitamin D
Vit. D
Vitamin A
Vit. A
Vitamin E
Vit. E
Vitamin B1
Vit. B1
Vitamin B2
Vit. B2
Vitamin B3
Vit. B3
Vitamin B5
Vit. B5
Vitamin B6
Vit. B6
Vitamin B12
Vit. B12
Vitamin K
Vit. K
Folate
Folate
194%
0%
73%
4.2%
20%
27%
12%
19%
32%
0%
532%
79%
2
100 g
300 g
1 cup - 252g
Vitamin C
Vit. C
Vitamin D
Vit. D
Vitamin A
Vit. A
Vitamin E
Vit. E
Vitamin B1
Vit. B1
Vitamin B2
Vit. B2
Vitamin B3
Vit. B3
Vitamin B5
Vit. B5
Vitamin B6
Vit. B6
Vitamin B12
Vit. B12
Vitamin K
Vit. K
Folate
Folate
0%
0%
0%
0%
46%
7.6%
17%
0%
22%
0%
0%
14%
All nutrients comparison - raw data values
Nutrient
DV% diff.
Vitamin K
212.7µg
177%
Manganese
0.373mg
2.86mg
108%
Vitamin C
58.1mg
65%
Vitamin A
218µg
0µg
24%
Folate
105µg
18µg
22%
Phosphorus
58mg
120mg
9%
Vitamin B1
0.078mg
0.183mg
9%
Copper
0.157mg
0.226mg
8%
Potassium
296mg
107mg
6%
Iron
1.6mg
2.05mg
6%
Vitamin B2
0.115mg
0.033mg
6%
Vitamin B5
0.324mg
6%
Carbs
4.35g
19.86g
5%
Zinc
0.56mg
1.11mg
5%
Calories
30kcal
101kcal
4%
Calcium
92mg
49mg
4%
Vitamin B6
0.138mg
0.097mg
3%
Magnesium
42mg
50mg
2%
Selenium
0.9µg
2%
Vitamin B3
0.647mg
0.909mg
2%
Polyunsaturated fat
0.267g
2%
Protein
3.27g
3.87g
1%
Fiber
2.5g
2.8g
1%
Vitamin E
0.21mg
1%
Choline
5.2mg
1%
Saturated fat
0.146g
1%
Protein per 100 calories
11g
3.8g
N/A
Calories per 10 g protein
92kcal
261kcal
N/A
Weight per 100 calories
333g
99g
N/A
Fats
0.73g
0.65g
0%
Net carbs
1.85g
17.06g
N/A
Sugar
1.85g
N/A
Sodium
3mg
8mg
0%
Monounsaturated fat
0.095g
0%
Tryptophan
0.037mg
0.041mg
0%
Threonine
0.128mg
0.149mg
0%
Isoleucine
0.139mg
0.146mg
0%
Leucine
0.195mg
0.311mg
0%
Lysine
0.163mg
0.109mg
0%
Methionine
0.036mg
0.125mg
0%
Phenylalanine
0.105mg
0.203mg
0%
Valine
0.145mg
0.2mg
0%
Histidine
0.057mg
0.088mg
0%
Macronutrient Comparison
Macronutrient breakdown side-by-side comparison
3
3%
4%
91%
Protein:
3.27 g
Fats:
0.73 g
Carbs:
4.35 g
Water:
90.65 g
Other:
1 g
2
4%
20%
75%
Protein:
3.87 g
Fats:
0.65 g
Carbs:
19.86 g
Water:
74.93 g
Other:
0.69 g
Contains
more
Fats Fats
+12.3%
Contains
more
Water Water
+21%
Contains
more
Other Other
+44.9%
Contains
more
Protein Protein
+18.3%
Contains
more
Carbs Carbs
+356.6%