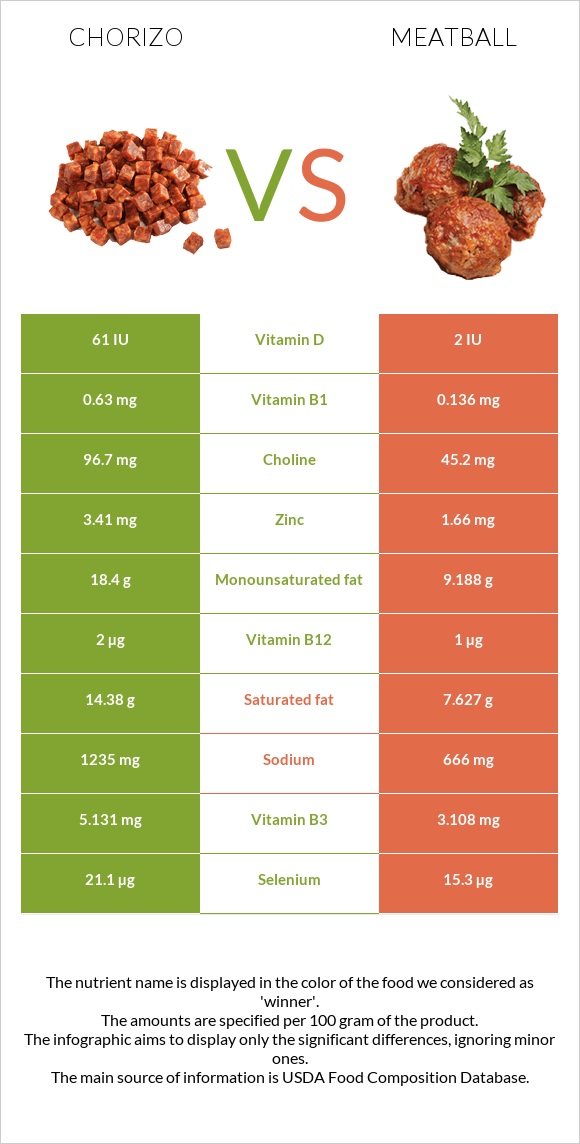
Differences between chorizo and meatball Chorizo has more vitamin B12, vitamin B1, vitamin B6, zinc, vitamin B3, and selenium, while meatball has more phosphorus and manganese. Chorizo's daily need coverage for vitamin B12 is 42% higher. Meatball contains 5 times less vitamin B1 than chorizo. Chorizo contains 0.63mg of vitamin B1, while meatball contains 0.136mg. The amount of saturated fat in meatball is lower. Meatball has a lower glycemic index. The glycemic index of meatball is 0, while the glycemic index of chorizo is 28. The food types used in this comparison are Chorizo, pork, and beef and Meatballs, frozen, Italian style .
Infographic
Mineral Comparison
Mineral comparison score is based on the number of minerals by which one or the other food is richer. The "coverage" charts below show how much of the daily needs can be covered by 300 grams of the food.
3
100 g
300 g
1 oz - 28.35g 1 link (4" long) - 60g
Magnesium
Magnesium
Calcium
Calcium
Potassium
Potassium
Iron
Iron
Copper
Copper
Zinc
Zinc
Phosphorus
Phosphorus
Sodium
Sodium
Manganese
Manganese
Selenium
Selenium
13%
2.4%
35%
60%
27%
93%
64%
161%
5.2%
115%
7
100 g
300 g
3 pieces - 56g 3 oz - 85g
Magnesium
Magnesium
Calcium
Calcium
Potassium
Potassium
Iron
Iron
Copper
Copper
Zinc
Zinc
Phosphorus
Phosphorus
Sodium
Sodium
Manganese
Manganese
Selenium
Selenium
22%
24%
26%
66%
41%
45%
102%
87%
37%
83%
Vitamin Comparison
Vitamin comparison score is based on the number of vitamins by which one or the other food is richer. The "coverage" charts below show how much of the daily needs can be covered by 300 grams of the food.
7
100 g
300 g
1 oz - 28.35g 1 link (4" long) - 60g
Vitamin C
Vit. C
Vitamin D
Vit. D
Vitamin A
Vit. A
Vitamin E
Vit. E
Vitamin B1
Vit. B1
Vitamin B2
Vit. B2
Vitamin B3
Vit. B3
Vitamin B5
Vit. B5
Vitamin B6
Vit. B6
Vitamin B12
Vit. B12
Vitamin K
Vit. K
Folate
Folate
0%
23%
0%
4.4%
158%
69%
96%
67%
122%
250%
4%
1.5%
4
100 g
300 g
3 pieces - 56g 3 oz - 85g
Vitamin C
Vit. C
Vitamin D
Vit. D
Vitamin A
Vit. A
Vitamin E
Vit. E
Vitamin B1
Vit. B1
Vitamin B2
Vit. B2
Vitamin B3
Vit. B3
Vitamin B5
Vit. B5
Vitamin B6
Vit. B6
Vitamin B12
Vit. B12
Vitamin K
Vit. K
Folate
Folate
0%
1.5%
7.3%
8.4%
34%
53%
58%
55%
47%
125%
21%
27%
All nutrients comparison - raw data values
Nutrient
DV% diff.
Vitamin B12
2µg
1µg
42%
Vitamin B1
0.63mg
0.136mg
41%
Saturated fat
14.38g
7.627g
31%
Fats
38.27g
22.21g
25%
Sodium
1235mg
666mg
25%
Vitamin B6
0.53mg
0.202mg
25%
Monounsaturated fat
18.4g
9.188g
23%
Protein
24.1g
14.4g
19%
Zinc
3.41mg
1.66mg
16%
Phosphorus
150mg
239mg
13%
Vitamin B3
5.131mg
3.108mg
13%
Manganese
0.04mg
0.282mg
11%
Selenium
21.1µg
15.3µg
11%
Fiber
0g
2.3g
9%
Folate
2µg
36µg
9%
Choline
96.7mg
45.2mg
9%
Calories
455kcal
286kcal
8%
Cholesterol
88mg
66mg
7%
Vitamin D*
61 IU
2 IU
7%
Vitamin D
1.5µg
0.1µg
7%
Calcium
8mg
80mg
7%
Vitamin K
1.6µg
8.2µg
6%
Copper
0.08mg
0.123mg
5%
Vitamin B2
0.3mg
0.23mg
5%
Vitamin B5
1.12mg
0.924mg
4%
Magnesium
18mg
31mg
3%
Potassium
398mg
296mg
3%
Carbs
1.86g
8.06g
2%
Iron
1.59mg
1.77mg
2%
Vitamin A
0µg
22µg
2%
Starch
2.25g
1%
Vitamin E
0.22mg
0.42mg
1%
Polyunsaturated fat
3.46g
3.346g
1%
Protein per 100 calories
5.3g
5g
N/A
Calories per 10 g protein
189kcal
199kcal
N/A
Weight per 100 calories
22g
35g
N/A
Unsaturated / Saturated Fat ratio
1.5
1.6
N/A
Net carbs
1.86g
5.76g
N/A
Sugar
0g
3.47g
N/A
Trans fat
0.577g
N/A
Tryptophan
0.278mg
0%
Threonine
1.473mg
0%
Isoleucine
2.206mg
0%
Leucine
1.708mg
0%
Lysine
2.414mg
0%
Methionine
0.47mg
0%
Phenylalanine
1.149mg
0%
Valine
0.914mg
0%
Histidine
0.721mg
0%
Fructose
0.21g
0%
Omega-3 - EPA
0g
0.005g
N/A
Omega-3 - DHA
0g
0.004g
N/A
Omega-3 - ALA
0.163g
N/A
Omega-3 - DPA
0g
0.013g
N/A
Omega-3 - Eicosatrienoic acid
0.012g
N/A
Omega-6 - Gamma-linoleic acid
0.005g
N/A
Omega-6 - Dihomo-gamma-linoleic acid
0.022g
N/A
Omega-6 - Eicosadienoic acid
0.07g
N/A
Omega-6 - Linoleic acid
2.815g
N/A
Macronutrient Comparison
Macronutrient breakdown side-by-side comparison
3
24%
38%
2%
32%
4%
Protein:
24.1 g
Fats:
38.27 g
Carbs:
1.86 g
Water:
31.85 g
Other:
3.92 g
2
14%
22%
8%
54%
Protein:
14.4 g
Fats:
22.21 g
Carbs:
8.06 g
Water:
53.67 g
Other:
1.66 g
Contains
more
Protein Protein
+67.4%
Contains
more
Fats Fats
+72.3%
Contains
more
Other Other
+136.1%
Contains
more
Carbs Carbs
+333.3%
Contains
more
Water Water
+68.5%
Fat Type Comparison
Fat type breakdown side-by-side comparison
2
40%
51%
10%
Saturated fat:
Sat. Fat
14.38 g
Monounsaturated fat:
Mono. Fat
18.4 g
Polyunsaturated fat:
Poly. Fat
3.46 g
1
38%
46%
17%
Saturated fat:
Sat. Fat
7.627 g
Monounsaturated fat:
Mono. Fat
9.188 g
Polyunsaturated fat:
Poly. Fat
3.346 g
Contains
more
Mono. Fat Monounsaturated fat
+100.3%
Contains
less
Sat. Fat Saturated fat
-47%
~equal in
Polyunsaturated fat
~3.346g