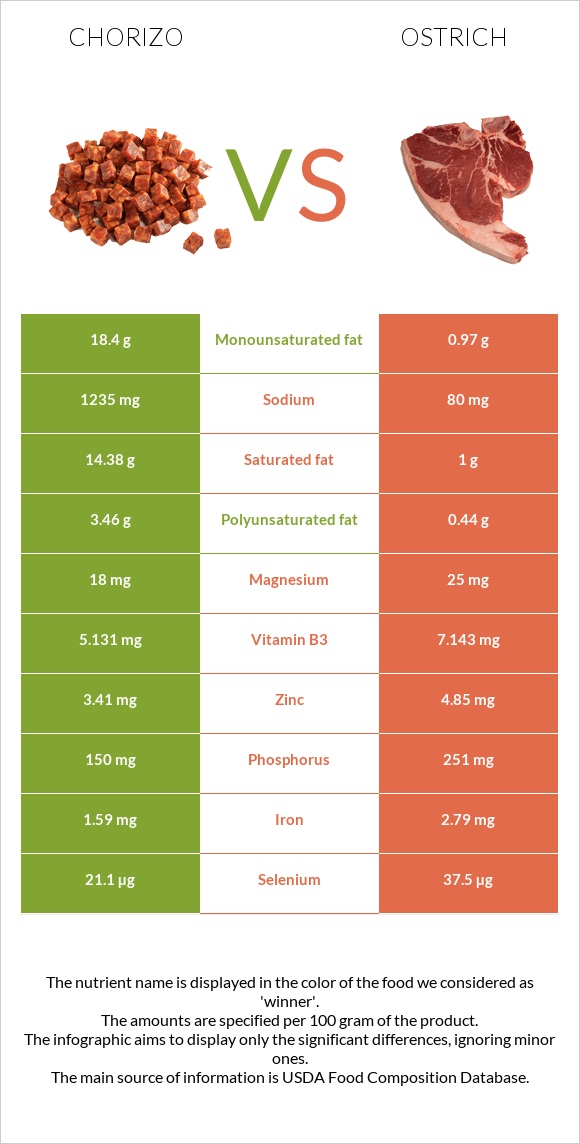
A recap on the differences between chorizo and ostrich Chorizo is higher in vitamin B1, yet ostrich is higher in vitamin B12, selenium, iron, phosphorus, zinc, vitamin B3, and copper. Ostrich covers your daily vitamin B12 needs 177% more than chorizo. Chorizo contains 15 times more sodium than ostrich. While chorizo contains 1235mg of sodium, ostrich contains only 80mg. The glycemic index of ostrich is lower. Food varieties used in this article are Chorizo, pork, and beef and Ostrich, tip trimmed, cooked .
Infographic
Mineral Comparison
Mineral comparison score is based on the number of minerals by which one or the other food is richer. The "coverage" charts below show how much of the daily needs can be covered by 300 grams of the food.
2
100 g
300 g
1 oz - 28.35g 1 link (4" long) - 60g
Magnesium
Magnesium
Calcium
Calcium
Potassium
Potassium
Iron
Iron
Copper
Copper
Zinc
Zinc
Phosphorus
Phosphorus
Sodium
Sodium
Manganese
Manganese
Selenium
Selenium
13%
2.4%
35%
60%
27%
93%
64%
161%
5.2%
115%
7
100 g
300 g
1 serving ( 3 oz ) - 85g
Magnesium
Magnesium
Calcium
Calcium
Potassium
Potassium
Iron
Iron
Copper
Copper
Zinc
Zinc
Phosphorus
Phosphorus
Sodium
Sodium
Manganese
Manganese
Selenium
Selenium
18%
1.8%
32%
105%
51%
132%
108%
10%
2.5%
205%
Vitamin Comparison
Vitamin comparison score is based on the number of vitamins by which one or the other food is richer. The "coverage" charts below show how much of the daily needs can be covered by 300 grams of the food.
3
100 g
300 g
1 oz - 28.35g 1 link (4" long) - 60g
Vitamin C
Vit. C
Vitamin D
Vit. D
Vitamin A
Vit. A
Vitamin E
Vit. E
Vitamin B1
Vit. B1
Vitamin B2
Vit. B2
Vitamin B3
Vit. B3
Vitamin B5
Vit. B5
Vitamin B6
Vit. B6
Vitamin B12
Vit. B12
Vitamin K
Vit. K
Folate
Folate
0%
23%
0%
4.4%
158%
69%
96%
67%
122%
250%
4%
1.5%
4
100 g
300 g
1 serving ( 3 oz ) - 85g
Vitamin C
Vit. C
Vitamin D
Vit. D
Vitamin A
Vit. A
Vitamin E
Vit. E
Vitamin B1
Vit. B1
Vitamin B2
Vit. B2
Vitamin B3
Vit. B3
Vitamin B5
Vit. B5
Vitamin B6
Vit. B6
Vitamin B12
Vit. B12
Vitamin K
Vit. K
Folate
Folate
0%
0%
0%
4.6%
58%
67%
134%
79%
126%
781%
0%
11%
All nutrients comparison - raw data values
Nutrient
DV% diff.
Vitamin B12
2µg
6.25µg
177%
Saturated fat
14.38g
1g
61%
Fats
38.27g
2.57g
55%
Sodium
1235mg
80mg
50%
Monounsaturated fat
18.4g
0.97g
44%
Vitamin B1
0.63mg
0.232mg
33%
Selenium
21.1µg
37.5µg
30%
Polyunsaturated fat
3.46g
0.44g
20%
Choline
96.7mg
18%
Calories
455kcal
145kcal
16%
Iron
1.59mg
2.79mg
15%
Phosphorus
150mg
251mg
14%
Zinc
3.41mg
4.85mg
13%
Vitamin B3
5.131mg
7.143mg
13%
Protein
24.1g
28.49g
9%
Vitamin D*
61 IU
8%
Vitamin D
1.5µg
8%
Copper
0.08mg
0.152mg
8%
Vitamin B5
1.12mg
1.318mg
4%
Folate
2µg
15µg
3%
Magnesium
18mg
25mg
2%
Carbs
1.86g
0g
1%
Cholesterol
88mg
85mg
1%
Potassium
398mg
362mg
1%
Manganese
0.04mg
0.019mg
1%
Vitamin B2
0.3mg
0.292mg
1%
Vitamin B6
0.53mg
0.545mg
1%
Vitamin K
1.6µg
1%
Protein per 100 calories
5.3g
20g
N/A
Calories per 10 g protein
189kcal
51kcal
N/A
Weight per 100 calories
22g
69g
N/A
Unsaturated / Saturated Fat ratio
1.5
1.4
N/A
Net carbs
1.86g
0g
N/A
Calcium
8mg
6mg
0%
Vitamin E
0.22mg
0.23mg
0%
Tryptophan
0.278mg
0.254mg
0%
Threonine
1.473mg
1.25mg
0%
Isoleucine
2.206mg
1.354mg
0%
Leucine
1.708mg
2.315mg
0%
Lysine
2.414mg
2.516mg
0%
Methionine
0.47mg
0.796mg
0%
Phenylalanine
1.149mg
1.176mg
0%
Valine
0.914mg
1.407mg
0%
Histidine
0.721mg
0.716mg
0%
Macronutrient Comparison
Macronutrient breakdown side-by-side comparison
3
24%
38%
2%
32%
4%
Protein:
24.1 g
Fats:
38.27 g
Carbs:
1.86 g
Water:
31.85 g
Other:
3.92 g
2
28%
3%
69%
Protein:
28.49 g
Fats:
2.57 g
Carbs:
0 g
Water:
68.51 g
Other:
0.43 g
Contains
more
Fats Fats
+1389.1%
Contains
more
Carbs Carbs
+∞%
Contains
more
Other Other
+811.6%
Contains
more
Protein Protein
+18.2%
Contains
more
Water Water
+115.1%
Fat Type Comparison
Fat type breakdown side-by-side comparison
2
40%
51%
10%
Saturated fat:
Sat. Fat
14.38 g
Monounsaturated fat:
Mono. Fat
18.4 g
Polyunsaturated fat:
Poly. Fat
3.46 g
1
41%
40%
18%
Saturated fat:
Sat. Fat
1 g
Monounsaturated fat:
Mono. Fat
0.97 g
Polyunsaturated fat:
Poly. Fat
0.44 g
Contains
more
Mono. Fat Monounsaturated fat
+1796.9%
Contains
more
Poly. Fat Polyunsaturated fat
+686.4%
Contains
less
Sat. Fat Saturated fat
-93%