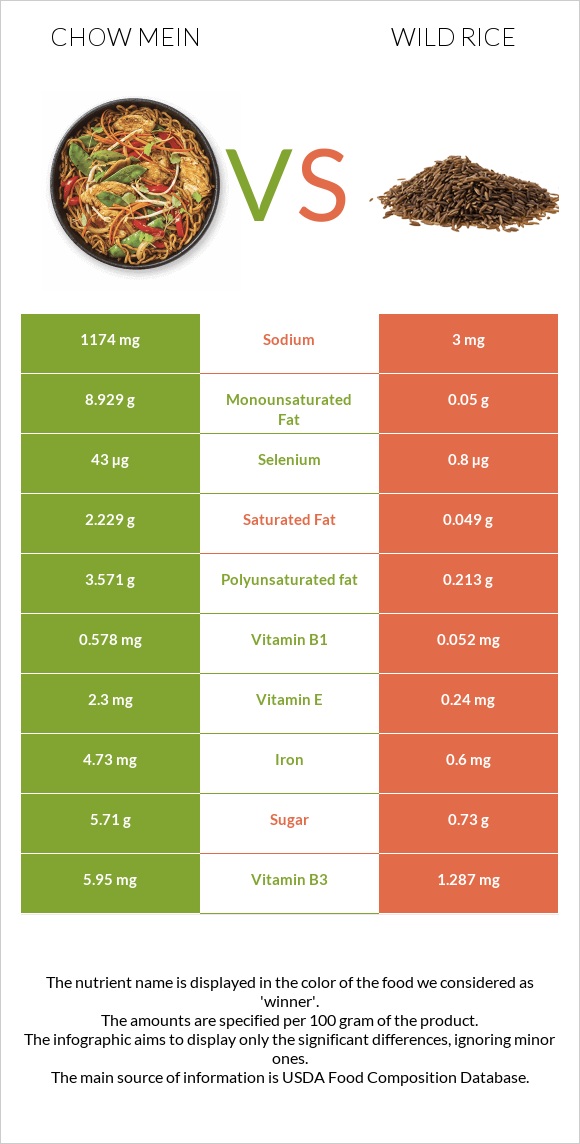
Important differences between chow mein and wild rice Wild rice has less selenium, iron, vitamin B1, vitamin B3, vitamin B2, folate, vitamin E, and phosphorus. Chow mein's daily need coverage for selenium is 77% more. Chow mein has 391 times more sodium than wild rice. Chow mein has 1174mg of sodium, while wild rice has 3mg. The food varieties used in the comparison are Noodles, chinese, chow mein and Wild rice, cooked .
Infographic
Mineral Comparison
Mineral comparison score is based on the number of minerals by which one or the other food is richer. The "coverage" charts below show how much of the daily needs can be covered by 300 grams of the food.
7
100 g
300 g
0.5 cup dry - 28g 1.5 oz - 43g
Magnesium
Magnesium
Calcium
Calcium
Potassium
Potassium
Iron
Iron
Copper
Copper
Zinc
Zinc
Phosphorus
Phosphorus
Sodium
Sodium
Manganese
Manganese
Selenium
Selenium
37%
6%
11%
177%
56%
38%
69%
153%
0%
235%
2
100 g
300 g
1 cup - 164g
Magnesium
Magnesium
Calcium
Calcium
Potassium
Potassium
Iron
Iron
Copper
Copper
Zinc
Zinc
Phosphorus
Phosphorus
Sodium
Sodium
Manganese
Manganese
Selenium
Selenium
23%
0.9%
8.9%
23%
40%
37%
35%
0.39%
37%
4.4%
Vitamin Comparison
Vitamin comparison score is based on the number of vitamins by which one or the other food is richer. The "coverage" charts below show how much of the daily needs can be covered by 300 grams of the food.
7
100 g
300 g
0.5 cup dry - 28g 1.5 oz - 43g
Vitamin C
Vit. C
Vitamin D
Vit. D
Vitamin A
Vit. A
Vitamin E
Vit. E
Vitamin B1
Vit. B1
Vitamin B2
Vit. B2
Vitamin B3
Vit. B3
Vitamin B5
Vit. B5
Vitamin B6
Vit. B6
Vitamin B12
Vit. B12
Vitamin K
Vit. K
Folate
Folate
0%
0%
0%
46%
145%
97%
112%
32%
25%
0%
3.5%
80%
1
100 g
300 g
1 cup - 164g
Vitamin C
Vit. C
Vitamin D
Vit. D
Vitamin A
Vit. A
Vitamin E
Vit. E
Vitamin B1
Vit. B1
Vitamin B2
Vit. B2
Vitamin B3
Vit. B3
Vitamin B5
Vit. B5
Vitamin B6
Vit. B6
Vitamin B12
Vit. B12
Vitamin K
Vit. K
Folate
Folate
0%
0%
0%
4.8%
13%
20%
24%
9.2%
31%
0%
1.3%
20%
All nutrients comparison - raw data values
Nutrient
DV% diff.
Selenium
43µg
0.8µg
77%
Iron
4.73mg
0.6mg
52%
Sodium
1174mg
3mg
51%
Vitamin B1
0.578mg
0.052mg
44%
Vitamin B3
5.95mg
1.287mg
29%
Vitamin B2
0.421mg
0.087mg
26%
Fats
15.43g
0.34g
23%
Monounsaturated fat
8.929g
0.05g
22%
Polyunsaturated fat
3.571g
0.213g
22%
Folate
106µg
26µg
20%
Calories
475kcal
101kcal
19%
Carbs
72.8g
21.34g
17%
Vitamin E
2.3mg
0.24mg
14%
Manganese
0.282mg
12%
Phosphorus
161mg
82mg
11%
Saturated fat
2.229g
0.049g
10%
Protein
8.11g
3.99g
8%
Fiber
3.7g
1.8g
8%
Vitamin B5
0.533mg
0.154mg
8%
Magnesium
52mg
32mg
5%
Copper
0.167mg
0.121mg
5%
Calcium
20mg
3mg
2%
Vitamin B6
0.11mg
0.135mg
2%
Potassium
120mg
101mg
1%
Zinc
1.4mg
1.34mg
1%
Vitamin K
1.4µg
0.5µg
1%
Protein per 100 calories
1.7g
4g
N/A
Calories per 10 g protein
586kcal
253kcal
N/A
Weight per 100 calories
21g
99g
N/A
Unsaturated / Saturated Fat ratio
5.6
5.4
N/A
Net carbs
69.1g
19.54g
N/A
Sugar
5.71g
0.73g
N/A
Trans fat
0.8g
N/A
Choline
8.7mg
10.2mg
0%
Tryptophan
0.049mg
0%
Threonine
0.127mg
0%
Isoleucine
0.167mg
0%
Leucine
0.276mg
0%
Lysine
0.17mg
0%
Methionine
0.119mg
0%
Phenylalanine
0.195mg
0%
Valine
0.232mg
0%
Histidine
0.104mg
0%
Fructose
0.2g
0%
Macronutrient Comparison
Macronutrient breakdown side-by-side comparison
4
8%
15%
73%
2%
Protein:
8.11 g
Fats:
15.43 g
Carbs:
72.8 g
Water:
1.18 g
Other:
2.48 g
1
4%
21%
74%
Protein:
3.99 g
Fats:
0.34 g
Carbs:
21.34 g
Water:
73.93 g
Other:
0.4 g
Contains
more
Protein Protein
+103.3%
Contains
more
Fats Fats
+4438.2%
Contains
more
Carbs Carbs
+241.1%
Contains
more
Other Other
+520%
Contains
more
Water Water
+6165.3%
Fat Type Comparison
Fat type breakdown side-by-side comparison
2
15%
61%
24%
Saturated fat:
Sat. Fat
2.229 g
Monounsaturated fat:
Mono. Fat
8.929 g
Polyunsaturated fat:
Poly. Fat
3.571 g
1
16%
16%
68%
Saturated fat:
Sat. Fat
0.049 g
Monounsaturated fat:
Mono. Fat
0.05 g
Polyunsaturated fat:
Poly. Fat
0.213 g
Contains
more
Mono. Fat Monounsaturated fat
+17758%
Contains
more
Poly. Fat Polyunsaturated fat
+1576.5%
Contains
less
Sat. Fat Saturated fat
-97.8%