Chowder vs. Marinara sauce — In-Depth Nutrition Comparison
Compare
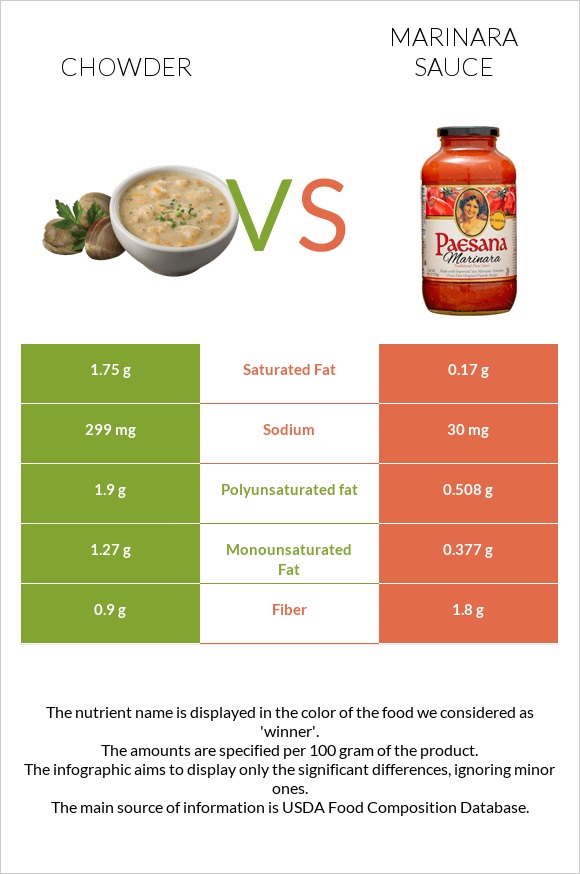
Differences between chowder and marinara sauce
- Marinara sauce contains less vitamin A, polyunsaturated fat, and monounsaturated fat than chowder.
- Chowder's daily need coverage for sodium is 12% higher.
- Marinara sauce contains 10 times less saturated fat than chowder. Chowder contains 1.75g of saturated fat, while marinara sauce contains 0.17g.
The food types used in this comparison are Soup, chicken corn chowder, chunky, ready-to-serve, single brand and Sauce, pasta, spaghetti/marinara, ready-to-serve, low sodium.
Infographic
Infographic link
Mineral Comparison
Mineral comparison score is based on the number of minerals by which one or the other food is richer. The "coverage" charts below show how much of the daily needs can be covered by 300 grams of the food.
| Contains less SodiumSodium | -90% |
Vitamin Comparison
Vitamin comparison score is based on the number of vitamins by which one or the other food is richer. The "coverage" charts below show how much of the daily needs can be covered by 300 grams of the food.
| Contains more Vitamin AVitamin A | +75.8% |
All nutrients comparison - raw data values
| Nutrient |  |
 |
DV% diff. |
| Vitamin B3 | 3.917mg | 24% | |
| Vitamin E | 2.4mg | 16% | |
| Vitamin B6 | 0.173mg | 13% | |
| Sodium | 299mg | 30mg | 12% |
| Vitamin K | 13.9µg | 12% | |
| Iron | 0.78mg | 10% | |
| Potassium | 319mg | 9% | |
| Copper | 0.081mg | 9% | |
| Polyunsaturated fat | 1.9g | 0.508g | 9% |
| Fats | 6.3g | 1.48g | 7% |
| Saturated fat | 1.75g | 0.17g | 7% |
| Manganese | 0.137mg | 6% | |
| Phosphorus | 34mg | 5% | |
| Vitamin B2 | 0.061mg | 5% | |
| Magnesium | 18mg | 4% | |
| Fiber | 0.9g | 1.8g | 4% |
| Protein | 3.1g | 1.41g | 3% |
| Cholesterol | 11mg | 2mg | 3% |
| Calcium | 27mg | 3% | |
| Vitamin A | 58µg | 33µg | 3% |
| Folate | 13µg | 3% | |
| Calories | 99kcal | 51kcal | 2% |
| Vitamin C | 2mg | 2% | |
| Zinc | 0.2mg | 2% | |
| Selenium | 1.1µg | 2% | |
| Vitamin B1 | 0.024mg | 2% | |
| Choline | 13.7mg | 2% | |
| Monounsaturated fat | 1.27g | 0.377g | 2% |
| Net carbs | 6.6g | 6.26g | N/A |
| Carbs | 7.5g | 8.06g | 0% |
| Sugar | 5.5g | N/A |
Macronutrient Comparison
Macronutrient breakdown side-by-side comparison
Protein:
3.1 g
Fats:
6.3 g
Carbs:
7.5 g
Water:
82.1 g
Other:
1 g
Protein:
1.41 g
Fats:
1.48 g
Carbs:
8.06 g
Water:
87.39 g
Other:
1.66 g
| Contains more ProteinProtein | +119.9% |
| Contains more FatsFats | +325.7% |
| Contains more OtherOther | +66% |
~equal in
Carbs
~8.06g
~equal in
Water
~87.39g
Fat Type Comparison
Fat type breakdown side-by-side comparison
Saturated fat:
Sat. Fat
1.75 g
Monounsaturated fat:
Mono. Fat
1.27 g
Polyunsaturated fat:
Poly. Fat
1.9 g
Saturated fat:
Sat. Fat
0.17 g
Monounsaturated fat:
Mono. Fat
0.377 g
Polyunsaturated fat:
Poly. Fat
0.508 g
| Contains more Mono. FatMonounsaturated fat | +236.9% |
| Contains more Poly. FatPolyunsaturated fat | +274% |
| Contains less Sat. FatSaturated fat | -90.3% |


