How are clam and eggs different? Clam has more vitamin B12, selenium, manganese, vitamin C, phosphorus, vitamin B3, and iron; however, eggs are richer in copper. Clam covers your daily need for vitamin B12, 4074% more than eggs. Eggs contain less sodium. Clam has a higher glycemic index. The glycemic index of clam is 27, while the glycemic index of eggs is 0. Mollusks, clam, mixed species, cooked, moist heat and Egg, whole, cooked, hard-boiled types were used in this article.
Infographic
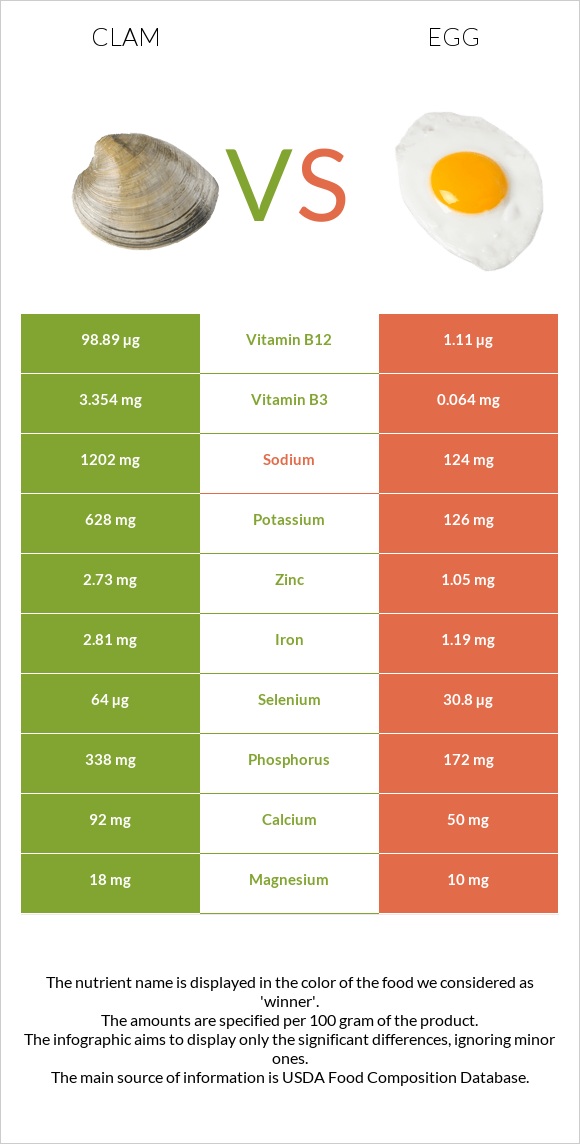
Mineral Comparison
Mineral comparison score is based on the number of minerals by which one or the other food is richer. The "coverage" charts below show how much of the daily needs can be covered by 300 grams of the food.
8
100 g
300 g
3 oz - 85g 20 small - 190g
Magnesium
Magnesium
Calcium
Calcium
Potassium
Potassium
Iron
Iron
Copper
Copper
Zinc
Zinc
Phosphorus
Phosphorus
Sodium
Sodium
Manganese
Manganese
Selenium
Selenium
13%
28%
55%
105%
229%
74%
145%
157%
130%
349%
2
100 g
300 g
1 tbsp - 8.5g 1 large - 50g 1 cup, chopped - 136g
Magnesium
Magnesium
Calcium
Calcium
Potassium
Potassium
Iron
Iron
Copper
Copper
Zinc
Zinc
Phosphorus
Phosphorus
Sodium
Sodium
Manganese
Manganese
Selenium
Selenium
7.1%
15%
11%
45%
667%
29%
74%
16%
3.4%
168%
Vitamin Comparison
Vitamin comparison score is based on the number of vitamins by which one or the other food is richer. The "coverage" charts below show how much of the daily needs can be covered by 300 grams of the food.
5
100 g
300 g
3 oz - 85g 20 small - 190g
Vitamin C
Vit. C
Vitamin D
Vit. D
Vitamin A
Vit. A
Vitamin E
Vit. E
Vitamin B1
Vit. B1
Vitamin B2
Vit. B2
Vitamin B3
Vit. B3
Vitamin B5
Vit. B5
Vitamin B6
Vit. B6
Vitamin B12
Vit. B12
Vitamin K
Vit. K
Folate
Folate
74%
0%
57%
0%
38%
98%
63%
41%
25%
12361%
0%
22%
6
100 g
300 g
1 tbsp - 8.5g 1 large - 50g 1 cup, chopped - 136g
Vitamin C
Vit. C
Vitamin D
Vit. D
Vitamin A
Vit. A
Vitamin E
Vit. E
Vitamin B1
Vit. B1
Vitamin B2
Vit. B2
Vitamin B3
Vit. B3
Vitamin B5
Vit. B5
Vitamin B6
Vit. B6
Vitamin B12
Vit. B12
Vitamin K
Vit. K
Folate
Folate
0%
33%
50%
21%
17%
118%
1.2%
84%
28%
139%
0.75%
33%
All nutrients comparison - raw data values
Nutrient
DV% diff.
Vitamin B12
98.89µg
1.11µg
4074%
Copper
0.688mg
2mg
146%
Cholesterol
67mg
373mg
102%
Selenium
64µg
30.8µg
60%
Choline
293.8mg
53%
Sodium
1202mg
124mg
47%
Manganese
1mg
0.026mg
42%
Protein
25.55g
12.58g
26%
Vitamin C
22.1mg
0mg
25%
Phosphorus
338mg
172mg
24%
Vitamin B3
3.354mg
0.064mg
21%
Iron
2.81mg
1.19mg
20%
Potassium
628mg
126mg
15%
Zinc
2.73mg
1.05mg
15%
Vitamin B5
0.68mg
1.398mg
14%
Saturated fat
0.188g
3.267g
14%
Fats
1.95g
10.61g
13%
Vitamin D*
87 IU
11%
Vitamin D
2.2µg
11%
Monounsaturated fat
0.172g
4.077g
10%
Vitamin E
1.03mg
7%
Vitamin B1
0.15mg
0.066mg
7%
Vitamin B2
0.426mg
0.513mg
7%
Polyunsaturated fat
0.552g
1.414g
6%
Calcium
92mg
50mg
4%
Folate
29µg
44µg
4%
Magnesium
18mg
10mg
2%
Vitamin A
171µg
149µg
2%
Carbs
5.13g
1.12g
1%
Vitamin B6
0.11mg
0.121mg
1%
Calories
148kcal
155kcal
0%
Protein per 100 calories
17g
8.1g
N/A
Calories per 10 g protein
58kcal
123kcal
N/A
Weight per 100 calories
68g
65g
N/A
Unsaturated / Saturated Fat ratio
3.9
1.7
N/A
Net carbs
5.13g
1.12g
N/A
Sugar
1.12g
N/A
Vitamin K
0.3µg
0%
Tryptophan
0.286mg
0.153mg
0%
Threonine
1.099mg
0.604mg
0%
Isoleucine
1.112mg
0.686mg
0%
Leucine
1.798mg
1.075mg
0%
Lysine
1.909mg
0.904mg
0%
Methionine
0.576mg
0.392mg
0%
Phenylalanine
0.915mg
0.668mg
0%
Valine
1.116mg
0.767mg
0%
Histidine
0.49mg
0.298mg
0%
Omega-3 - EPA
0.138g
0.005g
N/A
Omega-3 - DHA
0.146g
0.038g
N/A
Omega-3 - DPA
0.104g
0g
N/A
Macronutrient Comparison
Macronutrient breakdown side-by-side comparison
3
26%
2%
5%
64%
4%
Protein:
25.55 g
Fats:
1.95 g
Carbs:
5.13 g
Water:
63.64 g
Other:
3.73 g
2
13%
11%
75%
Protein:
12.58 g
Fats:
10.61 g
Carbs:
1.12 g
Water:
74.62 g
Other:
1.07 g
Contains
more
Protein Protein
+103.1%
Contains
more
Carbs Carbs
+358%
Contains
more
Other Other
+248.6%
Contains
more
Fats Fats
+444.1%
Contains
more
Water Water
+17.3%
Fat Type Comparison
Fat type breakdown side-by-side comparison
1
21%
19%
61%
Saturated fat:
Sat. Fat
0.188 g
Monounsaturated fat:
Mono. Fat
0.172 g
Polyunsaturated fat:
Poly. Fat
0.552 g
2
37%
47%
16%
Saturated fat:
Sat. Fat
3.267 g
Monounsaturated fat:
Mono. Fat
4.077 g
Polyunsaturated fat:
Poly. Fat
1.414 g
Contains
less
Sat. Fat Saturated fat
-94.2%
Contains
more
Mono. Fat Monounsaturated fat
+2270.3%
Contains
more
Poly. Fat Polyunsaturated fat
+156.2%