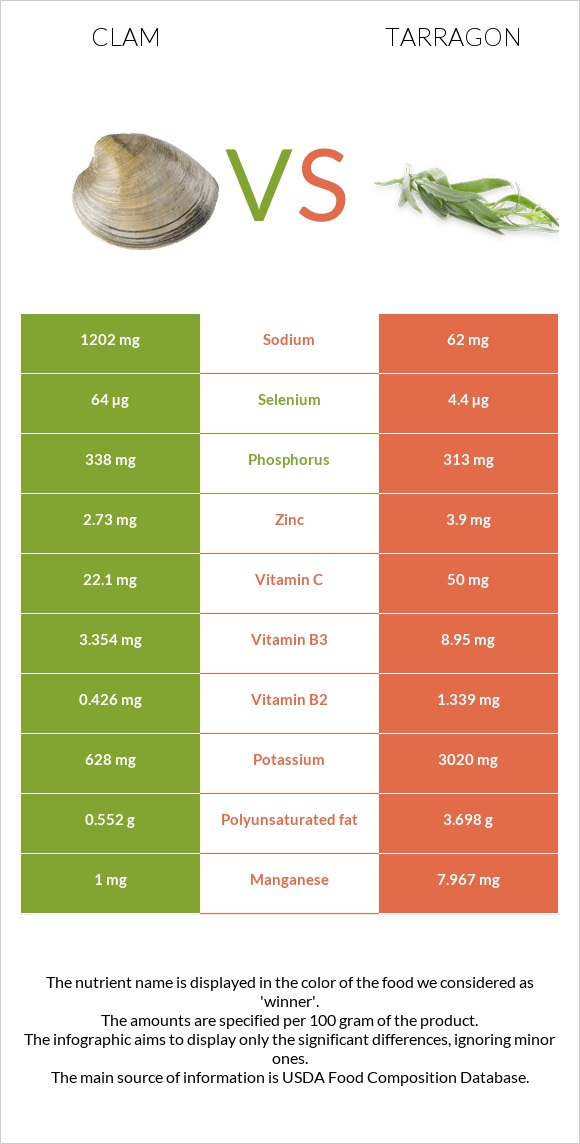
Significant differences between clam and tarragon Clam has more vitamin B12 and selenium; however, tarragon is richer in iron, manganese, vitamin B6, calcium, magnesium, vitamin A, potassium, and vitamin B2. Clam covers your daily vitamin B12 needs 4120% more than tarragon. Tarragon has 15 times less selenium than clam. Clam has 64µg of selenium, while tarragon has 4.4µg. Clam has a higher glycemic index. The glycemic index of clam is 27, while the glycemic index of tarragon is 0. Specific food types used in this comparison are Mollusks, clam, mixed species, cooked, moist heat and Spices, tarragon, dried .
Infographic
Mineral Comparison
Mineral comparison score is based on the number of minerals by which one or the other food is richer. The "coverage" charts below show how much of the daily needs can be covered by 300 grams of the food.
1
100 g
300 g
3 oz - 85g 20 small - 190g
Magnesium
Magnesium
Calcium
Calcium
Potassium
Potassium
Iron
Iron
Copper
Copper
Zinc
Zinc
Phosphorus
Phosphorus
Sodium
Sodium
Manganese
Manganese
Selenium
Selenium
13%
28%
55%
105%
229%
74%
145%
157%
130%
349%
7
100 g
300 g
0.25 tsp - 0.5g 1 tsp, ground - 1.6g 1 tbsp, leaves - 1.8g 1 tbsp, ground - 4.8g
Magnesium
Magnesium
Calcium
Calcium
Potassium
Potassium
Iron
Iron
Copper
Copper
Zinc
Zinc
Phosphorus
Phosphorus
Sodium
Sodium
Manganese
Manganese
Selenium
Selenium
248%
342%
266%
1211%
226%
106%
134%
8.1%
1039%
24%
Vitamin Comparison
Vitamin comparison score is based on the number of vitamins by which one or the other food is richer. The "coverage" charts below show how much of the daily needs can be covered by 300 grams of the food.
2
100 g
300 g
3 oz - 85g 20 small - 190g
Vitamin C
Vit. C
Vitamin D
Vit. D
Vitamin A
Vit. A
Vitamin E
Vit. E
Vitamin B1
Vit. B1
Vitamin B2
Vit. B2
Vitamin B3
Vit. B3
Vitamin B5
Vit. B5
Vitamin B6
Vit. B6
Vitamin B12
Vit. B12
Vitamin K
Vit. K
Folate
Folate
74%
0%
57%
0%
38%
98%
63%
41%
25%
12361%
0%
22%
7
100 g
300 g
0.25 tsp - 0.5g 1 tsp, ground - 1.6g 1 tbsp, leaves - 1.8g 1 tbsp, ground - 4.8g
Vitamin C
Vit. C
Vitamin D
Vit. D
Vitamin A
Vit. A
Vitamin E
Vit. E
Vitamin B1
Vit. B1
Vitamin B2
Vit. B2
Vitamin B3
Vit. B3
Vitamin B5
Vit. B5
Vitamin B6
Vit. B6
Vitamin B12
Vit. B12
Vitamin K
Vit. K
Folate
Folate
167%
0%
70%
0%
63%
309%
168%
0%
556%
0%
0%
206%
All nutrients comparison - raw data values
Nutrient
DV% diff.
Vitamin B12
98.89µg
0µg
4120%
Iron
2.81mg
32.3mg
369%
Manganese
1mg
7.967mg
303%
Vitamin B6
0.11mg
2.41mg
177%
Selenium
64µg
4.4µg
108%
Calcium
92mg
1139mg
105%
Magnesium
18mg
347mg
78%
Potassium
628mg
3020mg
70%
Vitamin B2
0.426mg
1.339mg
70%
Folate
29µg
274µg
61%
Sodium
1202mg
62mg
50%
Vitamin B3
3.354mg
8.95mg
35%
Vitamin C
22.1mg
50mg
31%
Fiber
0g
7.4g
30%
Cholesterol
67mg
0mg
22%
Polyunsaturated fat
0.552g
3.698g
21%
Carbs
5.13g
50.22g
15%
Vitamin B5
0.68mg
14%
Zinc
2.73mg
3.9mg
11%
Fats
1.95g
7.24g
8%
Vitamin B1
0.15mg
0.251mg
8%
Saturated fat
0.188g
1.881g
8%
Calories
148kcal
295kcal
7%
Protein
25.55g
22.77g
6%
Phosphorus
338mg
313mg
4%
Vitamin A
171µg
210µg
4%
Copper
0.688mg
0.677mg
1%
Monounsaturated fat
0.172g
0.474g
1%
Protein per 100 calories
17g
7.7g
N/A
Calories per 10 g protein
58kcal
130kcal
N/A
Weight per 100 calories
68g
34g
N/A
Unsaturated / Saturated Fat ratio
3.9
2.2
N/A
Net carbs
5.13g
42.82g
N/A
Tryptophan
0.286mg
0%
Threonine
1.099mg
0%
Isoleucine
1.112mg
0%
Leucine
1.798mg
0%
Lysine
1.909mg
0%
Methionine
0.576mg
0%
Phenylalanine
0.915mg
0%
Valine
1.116mg
0%
Histidine
0.49mg
0%
Omega-3 - EPA
0.138g
0g
N/A
Omega-3 - DHA
0.146g
0g
N/A
Omega-3 - DPA
0.104g
0g
N/A
Macronutrient Comparison
Macronutrient breakdown side-by-side comparison
2
26%
2%
5%
64%
4%
Protein:
25.55 g
Fats:
1.95 g
Carbs:
5.13 g
Water:
63.64 g
Other:
3.73 g
3
23%
7%
50%
8%
12%
Protein:
22.77 g
Fats:
7.24 g
Carbs:
50.22 g
Water:
7.74 g
Other:
12.03 g
Contains
more
Protein Protein
+12.2%
Contains
more
Water Water
+722.2%
Contains
more
Fats Fats
+271.3%
Contains
more
Carbs Carbs
+878.9%
Contains
more
Other Other
+222.5%
Fat Type Comparison
Fat type breakdown side-by-side comparison
1
21%
19%
61%
Saturated fat:
Sat. Fat
0.188 g
Monounsaturated fat:
Mono. Fat
0.172 g
Polyunsaturated fat:
Poly. Fat
0.552 g
2
31%
8%
61%
Saturated fat:
Sat. Fat
1.881 g
Monounsaturated fat:
Mono. Fat
0.474 g
Polyunsaturated fat:
Poly. Fat
3.698 g
Contains
less
Sat. Fat Saturated fat
-90%
Contains
more
Mono. Fat Monounsaturated fat
+175.6%
Contains
more
Poly. Fat Polyunsaturated fat
+569.9%