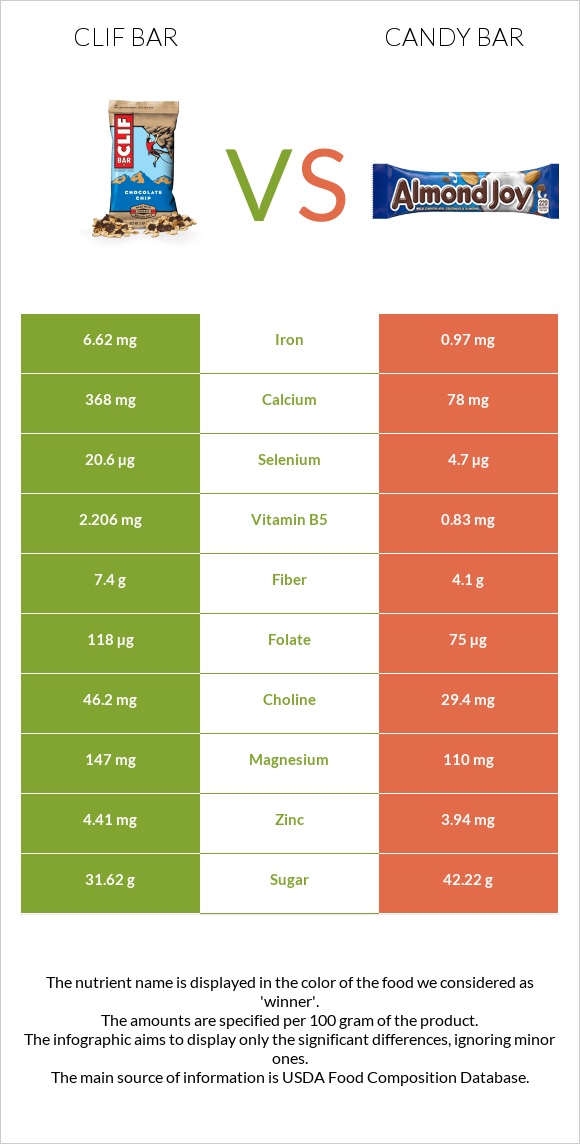
How are clif Bar and candy bar different? Clif Bar is richer in vitamin C, iron, vitamin B12, manganese, vitamin B1, vitamin K, calcium, and selenium, while candy bar is higher in vitamin B6 and copper. Candy bar covers your daily need for vitamin B6, 11724% more than clif Bar. Snacks, CLIF BAR, mixed flavors and Candies, peanut bar types were used in this article.
Infographic
Mineral Comparison
Mineral comparison score is based on the number of minerals by which one or the other food is richer. The "coverage" charts below show how much of the daily needs can be covered by 300 grams of the food.
6
100 g
300 g
1 bar - 68g
Magnesium
Magnesium
Calcium
Calcium
Potassium
Potassium
Iron
Iron
Copper
Copper
Zinc
Zinc
Phosphorus
Phosphorus
Sodium
Sodium
Manganese
Manganese
Selenium
Selenium
105%
110%
36%
248%
147%
120%
126%
25%
280%
112%
2
100 g
300 g
1 oz - 28.35g 1 bar (1.4 oz) - 40g 1 bar (1.6 oz) - 45g 1 bar (1.75 fl oz) - 50g
Magnesium
Magnesium
Calcium
Calcium
Potassium
Potassium
Iron
Iron
Copper
Copper
Zinc
Zinc
Phosphorus
Phosphorus
Sodium
Sodium
Manganese
Manganese
Selenium
Selenium
79%
23%
36%
36%
258%
107%
132%
20%
162%
26%
Vitamin Comparison
Vitamin comparison score is based on the number of vitamins by which one or the other food is richer. The "coverage" charts below show how much of the daily needs can be covered by 300 grams of the food.
8
100 g
300 g
1 bar - 68g
Vitamin C
Vit. C
Vitamin D
Vit. D
Vitamin A
Vit. A
Vitamin E
Vit. E
Vitamin B1
Vit. B1
Vitamin B2
Vit. B2
Vitamin B3
Vit. B3
Vitamin B5
Vit. B5
Vitamin B6
Vit. B6
Vitamin B12
Vit. B12
Vitamin K
Vit. K
Folate
Folate
294%
0%
0.33%
4.8%
138%
87%
83%
132%
136%
165%
92%
89%
3
100 g
300 g
1 oz - 28.35g 1 bar (1.4 oz) - 40g 1 bar (1.6 oz) - 45g 1 bar (1.75 fl oz) - 50g
Vitamin C
Vit. C
Vitamin D
Vit. D
Vitamin A
Vit. A
Vitamin E
Vit. E
Vitamin B1
Vit. B1
Vitamin B2
Vit. B2
Vitamin B3
Vit. B3
Vitamin B5
Vit. B5
Vitamin B6
Vit. B6
Vitamin B12
Vit. B12
Vitamin K
Vit. K
Folate
Folate
0%
0%
0%
82%
25%
32%
149%
50%
35308%
0%
0%
56%
All nutrients comparison - raw data values
Nutrient
DV% diff.
Vitamin B6
0.588mg
153mg
11724%
Vitamin C
88.2mg
0mg
98%
Iron
6.62mg
0.97mg
71%
Polyunsaturated fat
2.182g
10.65g
56%
Vitamin B12
1.32µg
0µg
55%
Fats
5.88g
33.7g
43%
Manganese
2.146mg
1.243mg
39%
Monounsaturated fat
1.093g
16.721g
39%
Vitamin B1
0.551mg
0.1mg
38%
Copper
0.441mg
0.774mg
37%
Vitamin K
36.8µg
0µg
31%
Calcium
368mg
78mg
29%
Selenium
20.6µg
4.7µg
29%
Vitamin B5
2.206mg
0.83mg
28%
Vitamin E
0.24mg
4.1mg
26%
Vitamin B3
4.412mg
7.922mg
22%
Vitamin B2
0.375mg
0.14mg
18%
Saturated fat
1.471g
4.678g
15%
Fiber
7.4g
4.1g
13%
Folate
118µg
75µg
11%
Calories
346kcal
522kcal
9%
Magnesium
147mg
110mg
9%
Carbs
65.44g
47.4g
6%
Zinc
4.41mg
3.94mg
4%
Choline
46.2mg
29.4mg
3%
Protein
14.71g
15.5g
2%
Phosphorus
294mg
308mg
2%
Sodium
195mg
156mg
2%
Protein per 100 calories
4.3g
3g
N/A
Calories per 10 g protein
235kcal
337kcal
N/A
Weight per 100 calories
29g
19g
N/A
Unsaturated / Saturated Fat ratio
2.2
5.9
N/A
Net carbs
58.04g
43.3g
N/A
Potassium
412mg
407mg
0%
Sugar
31.62g
42.22g
N/A
Vitamin A
1µg
0µg
0%
Tryptophan
0.149mg
0%
Threonine
0.52mg
0%
Isoleucine
0.534mg
0%
Leucine
0.986mg
0%
Lysine
0.545mg
0%
Methionine
0.185mg
0%
Phenylalanine
0.787mg
0%
Valine
0.638mg
0%
Histidine
0.385mg
0%
Macronutrient Comparison
Macronutrient breakdown side-by-side comparison
3
15%
6%
65%
11%
3%
Protein:
14.71 g
Fats:
5.88 g
Carbs:
65.44 g
Water:
11 g
Other:
2.97 g
2
16%
34%
47%
2%
Protein:
15.5 g
Fats:
33.7 g
Carbs:
47.4 g
Water:
1.6 g
Other:
1.8 g
Contains
more
Carbs Carbs
+38.1%
Contains
more
Water Water
+587.5%
Contains
more
Other Other
+65%
Contains
more
Fats Fats
+473.1%
Fat Type Comparison
Fat type breakdown side-by-side comparison
1
31%
23%
46%
Saturated fat:
Sat. Fat
1.471 g
Monounsaturated fat:
Mono. Fat
1.093 g
Polyunsaturated fat:
Poly. Fat
2.182 g
2
15%
52%
33%
Saturated fat:
Sat. Fat
4.678 g
Monounsaturated fat:
Mono. Fat
16.721 g
Polyunsaturated fat:
Poly. Fat
10.65 g
Contains
less
Sat. Fat Saturated fat
-68.6%
Contains
more
Mono. Fat Monounsaturated fat
+1429.8%
Contains
more
Poly. Fat Polyunsaturated fat
+388.1%