Cockles vs. Shad — In-Depth Nutrition Comparison
Compare
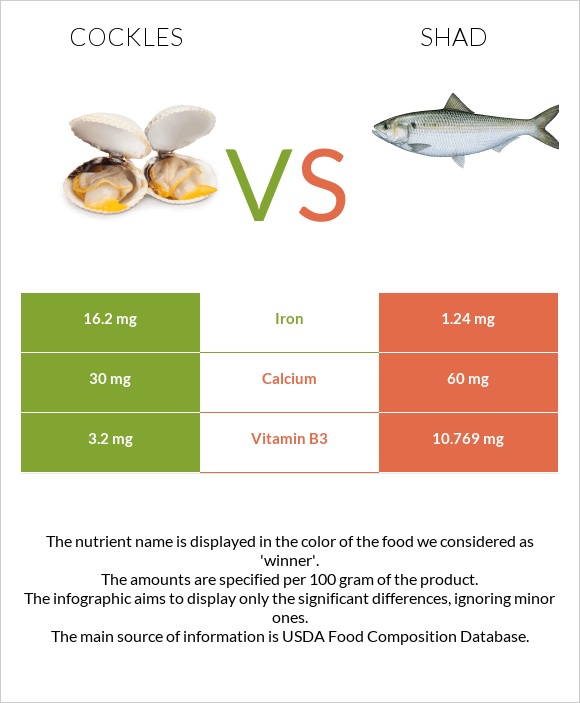
Summary of differences between cockles and shad
- Cockles have more iron; however, shad is higher in vitamin B3, vitamin B1, and vitamin B2.
- Cockles cover your daily need for iron, 187% more than shad.
These are the specific foods used in this comparison Cockles, raw (Alaska Native) and Fish, shad, american, cooked, dry heat.
Infographic
Infographic link
Mineral Comparison
Mineral comparison score is based on the number of minerals by which one or the other food is richer. The "coverage" charts below show how much of the daily needs can be covered by 300 grams of the food.
| Contains more IronIron | +1206.5% |
| Contains less SodiumSodium | -100% |
| Contains more CalciumCalcium | +100% |
Vitamin Comparison
Vitamin comparison score is based on the number of vitamins by which one or the other food is richer. The "coverage" charts below show how much of the daily needs can be covered by 300 grams of the food.
| Contains more Vitamin B1Vitamin B1 | +1730% |
| Contains more Vitamin B2Vitamin B2 | +54% |
| Contains more Vitamin B3Vitamin B3 | +236.5% |
All nutrients comparison - raw data values
| Nutrient |  |
 |
DV% diff. |
| Iron | 16.2mg | 1.24mg | 187% |
| Selenium | 46.8µg | 85% | |
| Phosphorus | 349mg | 50% | |
| Vitamin B3 | 3.2mg | 10.769mg | 47% |
| Vitamin B6 | 0.462mg | 36% | |
| Cholesterol | 96mg | 32% | |
| Fats | 0.7g | 17.65g | 26% |
| Vitamin B5 | 0.865mg | 17% | |
| Protein | 13.5g | 21.71g | 16% |
| Potassium | 492mg | 14% | |
| Vitamin B1 | 0.01mg | 0.183mg | 14% |
| Calories | 79kcal | 252kcal | 9% |
| Magnesium | 38mg | 9% | |
| Copper | 0.082mg | 9% | |
| Vitamin B2 | 0.2mg | 0.308mg | 8% |
| Vitamin B12 | 0.14µg | 6% | |
| Zinc | 0.47mg | 4% | |
| Vitamin A | 36µg | 4% | |
| Folate | 17µg | 4% | |
| Calcium | 30mg | 60mg | 3% |
| Sodium | 65mg | 3% | |
| Carbs | 4.7g | 0g | 2% |
| Manganese | 0.054mg | 2% | |
| Net carbs | 4.7g | 0g | N/A |
| Tryptophan | 0.243mg | 0% | |
| Threonine | 0.952mg | 0% | |
| Isoleucine | 1mg | 0% | |
| Leucine | 1.764mg | 0% | |
| Lysine | 1.993mg | 0% | |
| Methionine | 0.642mg | 0% | |
| Phenylalanine | 0.847mg | 0% | |
| Valine | 1.118mg | 0% | |
| Histidine | 0.639mg | 0% |
Macronutrient Comparison
Macronutrient breakdown side-by-side comparison
| Contains more CarbsCarbs | +∞% |
| Contains more WaterWater | +33.1% |
| Contains more OtherOther | +62% |
| Contains more ProteinProtein | +60.8% |
| Contains more FatsFats | +2421.4% |


