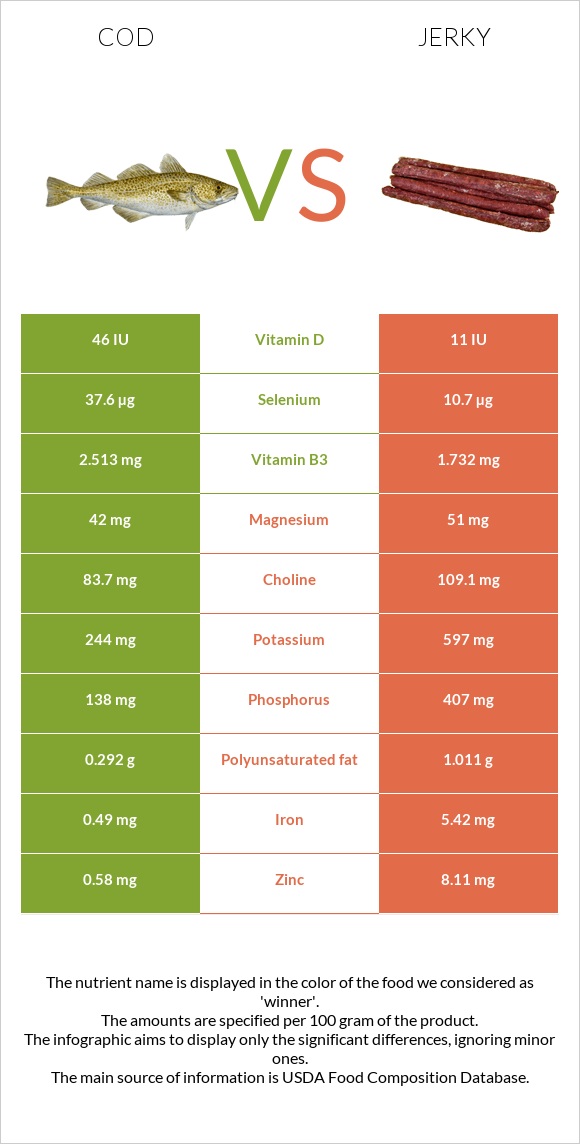
How are cod and jerky different? Cod is richer in selenium and vitamin B6, while jerky is higher in zinc, iron, phosphorus, folate, copper, and potassium. Jerky covers your daily need for sodium, 87% more than cod. Cod contains 4 times more selenium than jerky. Cod contains 37.6µg of selenium, while jerky contains 10.7µg. Cod is lower in sodium. Fish, cod, Atlantic, cooked, dry heat and Snacks, beef jerky, chopped, and formed types were used in this article.
Infographic
Mineral Comparison
Mineral comparison score is based on the number of minerals by which one or the other food is richer. The "coverage" charts below show how much of the daily needs can be covered by 300 grams of the food.
2
100 g
300 g
3 oz - 85g 1 fillet - 180g
Magnesium
Magnesium
Calcium
Calcium
Potassium
Potassium
Iron
Iron
Copper
Copper
Zinc
Zinc
Phosphorus
Phosphorus
Sodium
Sodium
Manganese
Manganese
Selenium
Selenium
30%
4.2%
22%
18%
12%
16%
59%
10%
2.6%
205%
8
100 g
300 g
1 piece, large - 20g 1 oz - 28.35g 1 oz - 28.35g
Magnesium
Magnesium
Calcium
Calcium
Potassium
Potassium
Iron
Iron
Copper
Copper
Zinc
Zinc
Phosphorus
Phosphorus
Sodium
Sodium
Manganese
Manganese
Selenium
Selenium
36%
6%
53%
203%
76%
221%
174%
271%
14%
58%
Vitamin Comparison
Vitamin comparison score is based on the number of vitamins by which one or the other food is richer. The "coverage" charts below show how much of the daily needs can be covered by 300 grams of the food.
6
100 g
300 g
3 oz - 85g 1 fillet - 180g
Vitamin C
Vit. C
Vitamin D
Vit. D
Vitamin A
Vit. A
Vitamin E
Vit. E
Vitamin B1
Vit. B1
Vitamin B2
Vit. B2
Vitamin B3
Vit. B3
Vitamin B5
Vit. B5
Vitamin B6
Vit. B6
Vitamin B12
Vit. B12
Vitamin K
Vit. K
Folate
Folate
3.3%
18%
4.7%
16%
22%
18%
47%
11%
65%
131%
0.25%
6%
4
100 g
300 g
1 piece, large - 20g 1 oz - 28.35g 1 oz - 28.35g
Vitamin C
Vit. C
Vitamin D
Vit. D
Vitamin A
Vit. A
Vitamin E
Vit. E
Vitamin B1
Vit. B1
Vitamin B2
Vit. B2
Vitamin B3
Vit. B3
Vitamin B5
Vit. B5
Vitamin B6
Vit. B6
Vitamin B12
Vit. B12
Vitamin K
Vit. K
Folate
Folate
0%
4.5%
0%
9.8%
39%
33%
32%
9.8%
41%
124%
5.8%
101%
All nutrients comparison - raw data values
Nutrient
DV% diff.
Sodium
78mg
2081mg
87%
Zinc
0.58mg
8.11mg
68%
Iron
0.49mg
5.42mg
62%
Selenium
37.6µg
10.7µg
49%
Saturated fat
0.168g
10.85g
49%
Fats
0.86g
25.6g
38%
Phosphorus
138mg
407mg
38%
Folate
8µg
134µg
32%
Monounsaturated fat
0.124g
11.305g
28%
Protein
22.83g
33.2g
21%
Copper
0.036mg
0.227mg
21%
Calories
105kcal
410kcal
15%
Potassium
244mg
597mg
10%
Vitamin B6
0.283mg
0.179mg
8%
Fiber
0g
1.8g
7%
Vitamin B1
0.088mg
0.154mg
6%
Vitamin D
1.2µg
0.3µg
5%
Vitamin B2
0.079mg
0.142mg
5%
Vitamin B3
2.513mg
1.732mg
5%
Choline
83.7mg
109.1mg
5%
Polyunsaturated fat
0.292g
1.011g
5%
Carbs
0g
11g
4%
Vitamin D*
46 IU
11 IU
4%
Manganese
0.02mg
0.111mg
4%
Vitamin B12
1.05µg
0.99µg
3%
Cholesterol
55mg
48mg
2%
Magnesium
42mg
51mg
2%
Vitamin A
14µg
0µg
2%
Vitamin E
0.81mg
0.49mg
2%
Vitamin K
0.1µg
2.3µg
2%
Vitamin C
1mg
0mg
1%
Calcium
14mg
20mg
1%
Protein per 100 calories
22g
8.1g
N/A
Calories per 10 g protein
46kcal
123kcal
N/A
Weight per 100 calories
95g
24g
N/A
Unsaturated / Saturated Fat ratio
2.5
1.1
N/A
Net carbs
0g
9.2g
N/A
Sugar
0g
9g
N/A
Vitamin B5
0.18mg
0.163mg
0%
Tryptophan
0.256mg
0%
Threonine
1.001mg
0%
Isoleucine
1.052mg
0%
Leucine
1.856mg
0%
Lysine
2.097mg
0%
Methionine
0.676mg
0%
Phenylalanine
0.891mg
0%
Valine
1.176mg
0%
Histidine
0.672mg
0%
Omega-3 - EPA
0.004g
0g
N/A
Omega-3 - DHA
0.154g
0g
N/A
Omega-3 - DPA
0.013g
0g
N/A
Macronutrient Comparison
Macronutrient breakdown side-by-side comparison
1
23%
76%
Protein:
22.83 g
Fats:
0.86 g
Carbs:
0 g
Water:
75.92 g
Other:
0.39 g
4
33%
26%
11%
23%
7%
Protein:
33.2 g
Fats:
25.6 g
Carbs:
11 g
Water:
23.36 g
Other:
6.84 g
Contains
more
Water Water
+225%
Contains
more
Protein Protein
+45.4%
Contains
more
Fats Fats
+2876.7%
Contains
more
Carbs Carbs
+∞%
Contains
more
Other Other
+1653.8%
Fat Type Comparison
Fat type breakdown side-by-side comparison
1
29%
21%
50%
Saturated fat:
Sat. Fat
0.168 g
Monounsaturated fat:
Mono. Fat
0.124 g
Polyunsaturated fat:
Poly. Fat
0.292 g
2
47%
49%
4%
Saturated fat:
Sat. Fat
10.85 g
Monounsaturated fat:
Mono. Fat
11.305 g
Polyunsaturated fat:
Poly. Fat
1.011 g
Contains
less
Sat. Fat Saturated fat
-98.5%
Contains
more
Mono. Fat Monounsaturated fat
+9016.9%
Contains
more
Poly. Fat Polyunsaturated fat
+246.2%