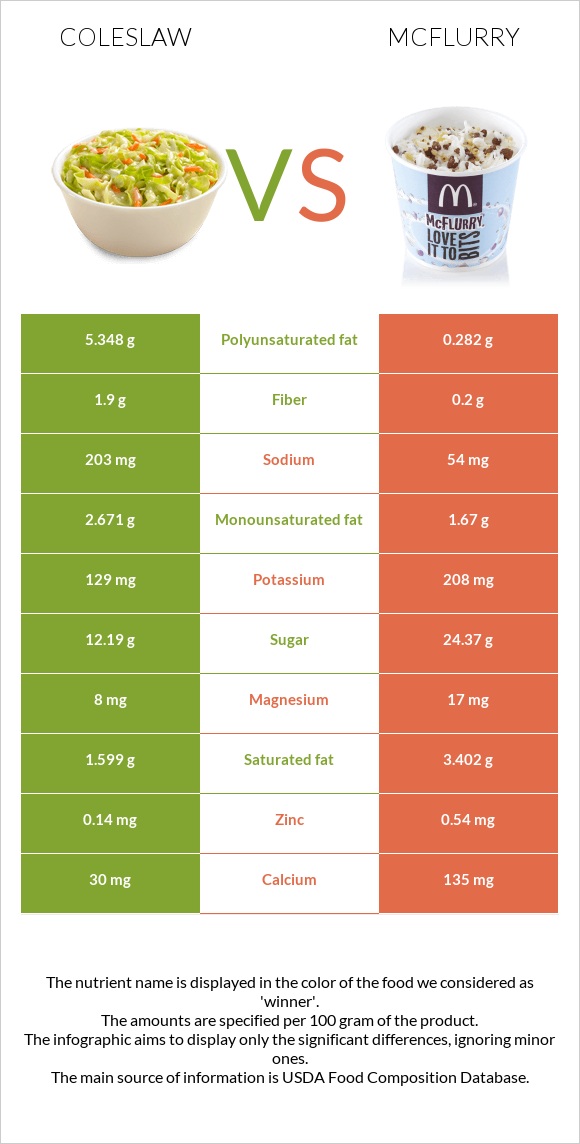
A recap on the differences between coleslaw and mcFlurry Coleslaw is higher in fiber, yet mcFlurry is higher in vitamin B12, vitamin B2, phosphorus, calcium, and vitamin B5. McFlurry covers your daily vitamin B12 needs 25% more than coleslaw. Coleslaw contains 10 times more fiber than mcFlurry. While coleslaw contains 1.9g of fiber, mcFlurry contains only 0.2g. The amount of sodium in mcFlurry is lower. Food varieties used in this article are Fast foods, coleslaw and McDONALD'S, McFLURRY with M&M'S CANDIES .
Infographic
Mineral Comparison
Mineral comparison score is based on the number of minerals by which one or the other food is richer. The "coverage" charts below show how much of the daily needs can be covered by 300 grams of the food.
1
100 g
300 g
1 package - 116g 1 cup - 191g
Magnesium
Magnesium
Calcium
Calcium
Potassium
Potassium
Iron
Iron
Copper
Copper
Zinc
Zinc
Phosphorus
Phosphorus
Sodium
Sodium
Manganese
Manganese
Selenium
Selenium
5.7%
9%
11%
8.3%
5%
3.8%
8.6%
26%
13%
0%
8
100 g
300 g
1 regular (12 fl oz) - 348g 1 large (16 fl oz) - 504g
Magnesium
Magnesium
Calcium
Calcium
Potassium
Potassium
Iron
Iron
Copper
Copper
Zinc
Zinc
Phosphorus
Phosphorus
Sodium
Sodium
Manganese
Manganese
Selenium
Selenium
12%
41%
18%
10%
15%
15%
50%
7%
6%
0%
Vitamin Comparison
Vitamin comparison score is based on the number of vitamins by which one or the other food is richer. The "coverage" charts below show how much of the daily needs can be covered by 300 grams of the food.
6
100 g
300 g
1 package - 116g 1 cup - 191g
Vitamin C
Vit. C
Vitamin D
Vit. D
Vitamin A
Vit. A
Vitamin E
Vit. E
Vitamin B1
Vit. B1
Vitamin B2
Vit. B2
Vitamin B3
Vit. B3
Vitamin B5
Vit. B5
Vitamin B6
Vit. B6
Vitamin B12
Vit. B12
Vitamin K
Vit. K
Folate
Folate
49%
0%
9.3%
11%
6.5%
4.6%
3.9%
15%
26%
1.3%
177%
0%
5
100 g
300 g
1 regular (12 fl oz) - 348g 1 large (16 fl oz) - 504g
Vitamin C
Vit. C
Vitamin D
Vit. D
Vitamin A
Vit. A
Vitamin E
Vit. E
Vitamin B1
Vit. B1
Vitamin B2
Vit. B2
Vitamin B3
Vit. B3
Vitamin B5
Vit. B5
Vitamin B6
Vit. B6
Vitamin B12
Vit. B12
Vitamin K
Vit. K
Folate
Folate
0%
0%
0%
1.6%
13%
56%
2.6%
44%
12%
75%
0%
2.3%
All nutrients comparison - raw data values
Nutrient
DV% diff.
Vitamin K
70.9µg
59%
Polyunsaturated fat
5.348g
0.282g
34%
Vitamin B12
0.01µg
0.6µg
25%
Vitamin B2
0.02mg
0.243mg
17%
Vitamin C
14.6mg
16%
Phosphorus
20mg
116mg
14%
Calcium
30mg
135mg
11%
Vitamin B5
0.246mg
0.73mg
10%
Saturated fat
1.599g
3.402g
8%
Fiber
1.9g
0.2g
7%
Protein
0.95g
4.02g
6%
Sodium
203mg
54mg
6%
Fats
9.91g
6.46g
5%
Vitamin B6
0.112mg
0.053mg
5%
Carbs
14.89g
26.82g
4%
Cholesterol
4mg
16mg
4%
Zinc
0.14mg
0.54mg
4%
Copper
0.015mg
0.044mg
3%
Vitamin A
28µg
3%
Vitamin E
0.54mg
0.08mg
3%
Monounsaturated fat
2.671g
1.67g
3%
Magnesium
8mg
17mg
2%
Potassium
129mg
208mg
2%
Manganese
0.102mg
0.046mg
2%
Vitamin B1
0.026mg
0.051mg
2%
Fructose
1.44g
0.21g
2%
Calories
153kcal
177kcal
1%
Iron
0.22mg
0.27mg
1%
Folate
3µg
1%
Protein per 100 calories
0.62g
2.3g
N/A
Calories per 10 g protein
1611kcal
440kcal
N/A
Weight per 100 calories
65g
56g
N/A
Unsaturated / Saturated Fat ratio
5
0.57
N/A
Net carbs
12.99g
26.62g
N/A
Sugar
12.19g
24.37g
N/A
Vitamin B3
0.206mg
0.139mg
0%
Trans fat
0.037g
0.281g
N/A
Omega-3 - EPA
0.006g
N/A
Omega-3 - DHA
0.001g
N/A
Omega-3 - ALA
0.279g
N/A
Omega-3 - Eicosatrienoic acid
0.001g
N/A
Omega-6 - Gamma-linoleic acid
0.024g
N/A
Omega-6 - Dihomo-gamma-linoleic acid
0.006g
N/A
Omega-6 - Eicosadienoic acid
0.002g
0g
N/A
Omega-6 - Linoleic acid
4.979g
N/A
Macronutrient Comparison
Macronutrient breakdown side-by-side comparison
2
10%
15%
73%
Protein:
0.95 g
Fats:
9.91 g
Carbs:
14.89 g
Water:
73.42 g
Other:
0.83 g
3
4%
6%
27%
62%
Protein:
4.02 g
Fats:
6.46 g
Carbs:
26.82 g
Water:
61.74 g
Other:
0.96 g
Contains
more
Fats Fats
+53.4%
Contains
more
Water Water
+18.9%
Contains
more
Protein Protein
+323.2%
Contains
more
Carbs Carbs
+80.1%
Contains
more
Other Other
+15.7%
Fat Type Comparison
Fat type breakdown side-by-side comparison
3
17%
28%
56%
Saturated fat:
Sat. Fat
1.599 g
Monounsaturated fat:
Mono. Fat
2.671 g
Polyunsaturated fat:
Poly. Fat
5.348 g
0
64%
31%
5%
Saturated fat:
Sat. Fat
3.402 g
Monounsaturated fat:
Mono. Fat
1.67 g
Polyunsaturated fat:
Poly. Fat
0.282 g
Contains
less
Sat. Fat Saturated fat
-53%
Contains
more
Mono. Fat Monounsaturated fat
+59.9%
Contains
more
Poly. Fat Polyunsaturated fat
+1796.5%
Carbohydrate type comparison
Carbohydrate type breakdown side-by-side comparison
3
74%
14%
12%
Starch:
0 g
Sucrose:
8.96 g
Glucose:
1.69 g
Fructose:
1.44 g
Lactose:
0 g
Maltose:
0 g
Galactose:
0.09 g
3
69%
3%
26%
Starch:
0 g
Sucrose:
16.9 g
Glucose:
0.75 g
Fructose:
0.21 g
Lactose:
6.23 g
Maltose:
0.28 g
Galactose:
0 g
Contains
more
Glucose Glucose
+125.3%
Contains
more
Fructose Fructose
+585.7%
Contains
more
Galactose Galactose
+∞%
Contains
more
Sucrose Sucrose
+88.6%
Contains
more
Lactose Lactose
+∞%
Contains
more
Maltose Maltose
+∞%