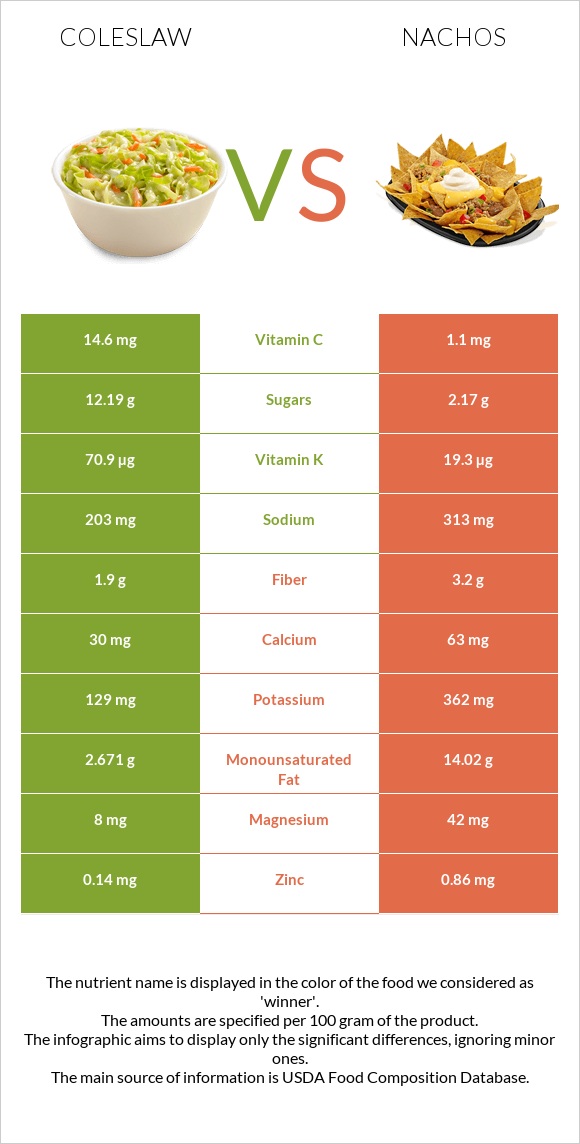
A recap on the differences between coleslaw and nachos Coleslaw is higher in vitamin K and vitamin C, yet nachos are higher in phosphorus, vitamin E, vitamin B2, magnesium, vitamin B1, vitamin B6, potassium, and iron. Coleslaw covers your daily vitamin K needs 43% more than nachos. Coleslaw contains 13 times more vitamin C than nachos. While coleslaw contains 14.6mg of vitamin C, nachos contain only 1.1mg. The glycemic index of coleslaw is lower. Food varieties used in this article are Fast foods, coleslaw and Fast foods, nachos, with cheese .
Infographic
Mineral Comparison
Mineral comparison score is based on the number of minerals by which one or the other food is richer. The "coverage" charts below show how much of the daily needs can be covered by 300 grams of the food.
1
100 g
300 g
1 package - 116g 1 cup - 191g
Magnesium
Magnesium
Calcium
Calcium
Potassium
Potassium
Iron
Iron
Copper
Copper
Zinc
Zinc
Phosphorus
Phosphorus
Sodium
Sodium
Manganese
Manganese
Selenium
Selenium
5.7%
9%
11%
8.3%
5%
3.8%
8.6%
26%
13%
0%
9
100 g
300 g
1 serving - 80g
Magnesium
Magnesium
Calcium
Calcium
Potassium
Potassium
Iron
Iron
Copper
Copper
Zinc
Zinc
Phosphorus
Phosphorus
Sodium
Sodium
Manganese
Manganese
Selenium
Selenium
30%
19%
32%
28%
21%
23%
85%
41%
24%
47%
Vitamin Comparison
Vitamin comparison score is based on the number of vitamins by which one or the other food is richer. The "coverage" charts below show how much of the daily needs can be covered by 300 grams of the food.
3
100 g
300 g
1 package - 116g 1 cup - 191g
Vitamin C
Vit. C
Vitamin D
Vit. D
Vitamin A
Vit. A
Vitamin E
Vit. E
Vitamin B1
Vit. B1
Vitamin B2
Vit. B2
Vitamin B3
Vit. B3
Vitamin B5
Vit. B5
Vitamin B6
Vit. B6
Vitamin B12
Vit. B12
Vitamin K
Vit. K
Folate
Folate
49%
0%
9.3%
11%
6.5%
4.6%
3.9%
15%
26%
1.3%
177%
0%
8
100 g
300 g
1 serving - 80g
Vitamin C
Vit. C
Vitamin D
Vit. D
Vitamin A
Vit. A
Vitamin E
Vit. E
Vitamin B1
Vit. B1
Vitamin B2
Vit. B2
Vitamin B3
Vit. B3
Vitamin B5
Vit. B5
Vitamin B6
Vit. B6
Vitamin B12
Vit. B12
Vitamin K
Vit. K
Folate
Folate
3.7%
0%
1.7%
82%
31%
31%
12%
23%
50%
8.8%
48%
7.5%
All nutrients comparison - raw data values
Nutrient
DV% diff.
Vitamin K
70.9µg
19.3µg
43%
Monounsaturated fat
2.671g
14.02g
28%
Phosphorus
20mg
198mg
25%
Vitamin E
0.54mg
4.08mg
24%
Fats
9.91g
21.5g
18%
Selenium
8.6µg
16%
Vitamin C
14.6mg
1.1mg
15%
Starch
28.33g
12%
Calories
153kcal
343kcal
10%
Vitamin B2
0.02mg
0.133mg
9%
Magnesium
8mg
42mg
8%
Vitamin B1
0.026mg
0.123mg
8%
Vitamin B6
0.112mg
0.215mg
8%
Protein
0.95g
4.32g
7%
Carbs
14.89g
34.91g
7%
Potassium
129mg
362mg
7%
Iron
0.22mg
0.75mg
7%
Zinc
0.14mg
0.86mg
7%
Fiber
1.9g
3.2g
5%
Copper
0.015mg
0.064mg
5%
Sodium
203mg
313mg
5%
Choline
26.4mg
5%
Manganese
0.102mg
0.187mg
4%
Calcium
30mg
63mg
3%
Vitamin A
28µg
5µg
3%
Vitamin B3
0.206mg
0.63mg
3%
Vitamin B5
0.246mg
0.38mg
3%
Vitamin B12
0.01µg
0.07µg
3%
Folate
10µg
3%
Saturated fat
1.599g
2.173g
3%
Polyunsaturated fat
5.348g
5.04g
2%
Fructose
1.44g
0g
2%
Protein per 100 calories
0.62g
1.3g
N/A
Calories per 10 g protein
1611kcal
794kcal
N/A
Weight per 100 calories
65g
29g
N/A
Unsaturated / Saturated Fat ratio
5
8.8
N/A
Net carbs
12.99g
31.71g
N/A
Cholesterol
4mg
3mg
0%
Sugar
12.19g
2.17g
N/A
Trans fat
0.037g
0.058g
N/A
Tryptophan
0.042mg
0%
Threonine
0.156mg
0%
Isoleucine
0.187mg
0%
Leucine
0.521mg
0%
Lysine
0.156mg
0%
Methionine
0.094mg
0%
Phenylalanine
0.229mg
0%
Valine
0.25mg
0%
Histidine
0.135mg
0%
Omega-3 - EPA
0.006g
0g
N/A
Omega-3 - DHA
0.001g
0g
N/A
Omega-3 - ALA
0.279g
0.617g
N/A
Omega-3 - Eicosatrienoic acid
0.001g
0g
N/A
Omega-6 - Gamma-linoleic acid
0.024g
0.032g
N/A
Omega-6 - Dihomo-gamma-linoleic acid
0.006g
0g
N/A
Omega-6 - Eicosadienoic acid
0.002g
0.011g
N/A
Omega-6 - Linoleic acid
4.979g
4.343g
N/A
Macronutrient Comparison
Macronutrient breakdown side-by-side comparison
1
10%
15%
73%
Protein:
0.95 g
Fats:
9.91 g
Carbs:
14.89 g
Water:
73.42 g
Other:
0.83 g
4
4%
22%
35%
37%
2%
Protein:
4.32 g
Fats:
21.5 g
Carbs:
34.91 g
Water:
37.4 g
Other:
1.87 g
Contains
more
Water Water
+96.3%
Contains
more
Protein Protein
+354.7%
Contains
more
Fats Fats
+117%
Contains
more
Carbs Carbs
+134.5%
Contains
more
Other Other
+125.3%
Fat Type Comparison
Fat type breakdown side-by-side comparison
2
17%
28%
56%
Saturated fat:
Sat. Fat
1.599 g
Monounsaturated fat:
Mono. Fat
2.671 g
Polyunsaturated fat:
Poly. Fat
5.348 g
1
10%
66%
24%
Saturated fat:
Sat. Fat
2.173 g
Monounsaturated fat:
Mono. Fat
14.02 g
Polyunsaturated fat:
Poly. Fat
5.04 g
Contains
less
Sat. Fat Saturated fat
-26.4%
Contains
more
Mono. Fat Monounsaturated fat
+424.9%
~equal in
Polyunsaturated fat
~5.04g
Carbohydrate type comparison
Carbohydrate type breakdown side-by-side comparison
4
74%
14%
12%
Starch:
0 g
Sucrose:
8.96 g
Glucose:
1.69 g
Fructose:
1.44 g
Lactose:
0 g
Maltose:
0 g
Galactose:
0.09 g
2
93%
2%
5%
Starch:
28.33 g
Sucrose:
0.53 g
Glucose:
0 g
Fructose:
0 g
Lactose:
1.63 g
Maltose:
0 g
Galactose:
0 g
Contains
more
Sucrose Sucrose
+1590.6%
Contains
more
Glucose Glucose
+∞%
Contains
more
Fructose Fructose
+∞%
Contains
more
Galactose Galactose
+∞%
Contains
more
Starch Starch
+∞%
Contains
more
Lactose Lactose
+∞%