Corn chips vs. Tamale — In-Depth Nutrition Comparison
Compare
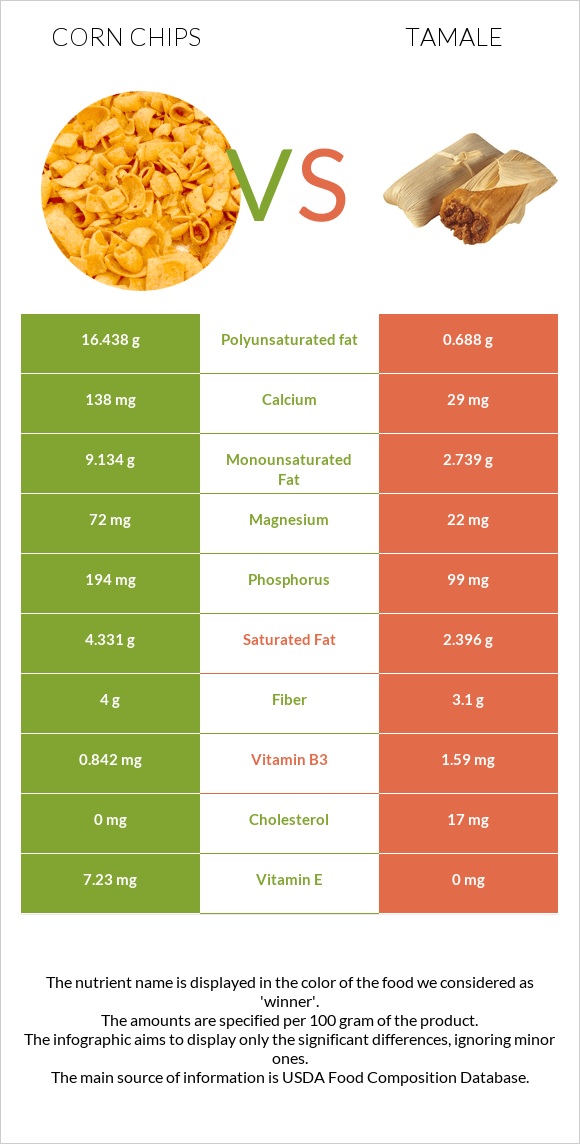
Significant differences between corn chips and tamale
- Corn chips have more vitamin E, phosphorus, magnesium, calcium, and manganese; however, tamale is richer in vitamin B12.
- Corn chips cover your daily vitamin E needs 48% more than tamale.
- Tamale has 5 times less calcium than corn chips. Corn chips have 138mg of calcium, while tamale has 29mg.
- Tamale contains less saturated fat.
- Tamale has a higher glycemic index. The glycemic index of tamale is 82, while the glycemic index of corn chips is 42.
Specific food types used in this comparison are Snacks, corn-based, extruded, chips, plain and Tamales (Navajo).
Infographic
Infographic link
Mineral Comparison
Mineral comparison score is based on the number of minerals by which one or the other food is richer. The "coverage" charts below show how much of the daily needs can be covered by 300 grams of the food.
| Contains more MagnesiumMagnesium | +227.3% |
| Contains more CalciumCalcium | +375.9% |
| Contains more CopperCopper | +60.3% |
| Contains more PhosphorusPhosphorus | +96% |
| Contains more ManganeseManganese | +91.4% |
| Contains more SeleniumSelenium | +26.7% |
| Contains more ZincZinc | +14.7% |
| Contains less SodiumSodium | -16.9% |
Vitamin Comparison
Vitamin comparison score is based on the number of vitamins by which one or the other food is richer. The "coverage" charts below show how much of the daily needs can be covered by 300 grams of the food.
| Contains more Vitamin AVitamin A | +∞% |
| Contains more Vitamin EVitamin E | +∞% |
| Contains more Vitamin B6Vitamin B6 | +16.8% |
| Contains more Vitamin KVitamin K | +∞% |
| Contains more Vitamin CVitamin C | +∞% |
| Contains more Vitamin B3Vitamin B3 | +88.8% |
| Contains more Vitamin B12Vitamin B12 | +∞% |
| Contains more FolateFolate | +87.5% |
All nutrients comparison - raw data values
| Nutrient |  |
 |
DV% diff. |
| Polyunsaturated fat | 16.438g | 0.688g | 105% |
| Vitamin E | 7.23mg | 0mg | 48% |
| Fats | 33.36g | 6.12g | 42% |
| Vitamin B12 | 0µg | 0.54µg | 23% |
| Calories | 538kcal | 153kcal | 19% |
| Starch | 51.36g | 12.27g | 16% |
| Monounsaturated fat | 9.134g | 2.739g | 16% |
| Phosphorus | 194mg | 99mg | 14% |
| Carbs | 56.9g | 18.12g | 13% |
| Magnesium | 72mg | 22mg | 12% |
| Calcium | 138mg | 29mg | 11% |
| Saturated fat | 4.331g | 2.396g | 9% |
| Manganese | 0.333mg | 0.174mg | 7% |
| Cholesterol | 0mg | 17mg | 6% |
| Vitamin B3 | 0.842mg | 1.59mg | 5% |
| Vitamin K | 6.3µg | 5% | |
| Fiber | 4g | 3.1g | 4% |
| Copper | 0.101mg | 0.063mg | 4% |
| Sodium | 514mg | 427mg | 4% |
| Selenium | 7.6µg | 6µg | 3% |
| Vitamin C | 0mg | 1.7mg | 2% |
| Zinc | 1.29mg | 1.48mg | 2% |
| Vitamin B6 | 0.167mg | 0.143mg | 2% |
| Folate | 8µg | 15µg | 2% |
| Choline | 12.1mg | 2% | |
| Protein | 6.17g | 6.28g | 0% |
| Protein per 100 calories | 1.1g | 4.1g | N/A |
| Calories per 10 g protein | 872kcal | 244kcal | N/A |
| Weight per 100 calories | 19g | 65g | N/A |
| Unsaturated / Saturated Fat ratio | 5.9 | 1.4 | N/A |
| Net carbs | 52.9g | 15.02g | N/A |
| Potassium | 144mg | 131mg | 0% |
| Iron | 1.2mg | 1.22mg | 0% |
| Sugar | 0.27g | 0.99g | N/A |
| Vitamin A | 3µg | 0µg | 0% |
| Vitamin B1 | 0.047mg | 0.05mg | 0% |
| Vitamin B2 | 0.078mg | 0.08mg | 0% |
| Vitamin B5 | 0.19mg | 0.205mg | 0% |
| Trans fat | 0.088g | N/A | |
| Tryptophan | 0.046mg | 0.052mg | 0% |
| Threonine | 0.246mg | 0.239mg | 0% |
| Isoleucine | 0.235mg | 0.271mg | 0% |
| Leucine | 0.803mg | 0.568mg | 0% |
| Lysine | 0.185mg | 0.427mg | 0% |
| Methionine | 0.137mg | 0.15mg | 0% |
| Phenylalanine | 0.322mg | 0.275mg | 0% |
| Valine | 0.331mg | 0.318mg | 0% |
| Histidine | 0.2mg | 0.196mg | 0% |
| Fructose | 0g | 0.17g | 0% |
| Omega-3 - EPA | 0.006g | N/A | |
| Omega-3 - ALA | 0.264g | 0.029g | N/A |
| Omega-3 - Eicosatrienoic acid | 0.006g | N/A | |
| Omega-6 - Gamma-linoleic acid | 0.013g | 0g | N/A |
| Omega-6 - Eicosadienoic acid | 0.007g | 0g | N/A |
| Omega-6 - Linoleic acid | 16.036g | N/A |
Macronutrient Comparison
Macronutrient breakdown side-by-side comparison
Protein:
6.17 g
Fats:
33.36 g
Carbs:
56.9 g
Water:
1.07 g
Other:
2.5 g
Protein:
6.28 g
Fats:
6.12 g
Carbs:
18.12 g
Water:
68.1 g
Other:
1.38 g
| Contains more FatsFats | +445.1% |
| Contains more CarbsCarbs | +214% |
| Contains more OtherOther | +81.2% |
| Contains more WaterWater | +6264.5% |
~equal in
Protein
~6.28g
Fat Type Comparison
Fat type breakdown side-by-side comparison
Saturated fat:
Sat. Fat
4.331 g
Monounsaturated fat:
Mono. Fat
9.134 g
Polyunsaturated fat:
Poly. Fat
16.438 g
Saturated fat:
Sat. Fat
2.396 g
Monounsaturated fat:
Mono. Fat
2.739 g
Polyunsaturated fat:
Poly. Fat
0.688 g
| Contains more Mono. FatMonounsaturated fat | +233.5% |
| Contains more Poly. FatPolyunsaturated fat | +2289.2% |
| Contains less Sat. FatSaturated fat | -44.7% |
Carbohydrate type comparison
Carbohydrate type breakdown side-by-side comparison
Starch:
51.36 g
Sucrose:
0.27 g
Glucose:
0 g
Fructose:
0 g
Lactose:
0 g
Maltose:
0 g
Galactose:
0 g
Starch:
12.27 g
Sucrose:
0.4 g
Glucose:
0.21 g
Fructose:
0.17 g
Lactose:
0 g
Maltose:
0.22 g
Galactose:
0 g
| Contains more StarchStarch | +318.6% |
| Contains more SucroseSucrose | +48.1% |
| Contains more GlucoseGlucose | +∞% |
| Contains more FructoseFructose | +∞% |
| Contains more MaltoseMaltose | +∞% |
~equal in
Lactose
~0g
~equal in
Galactose
~0g


