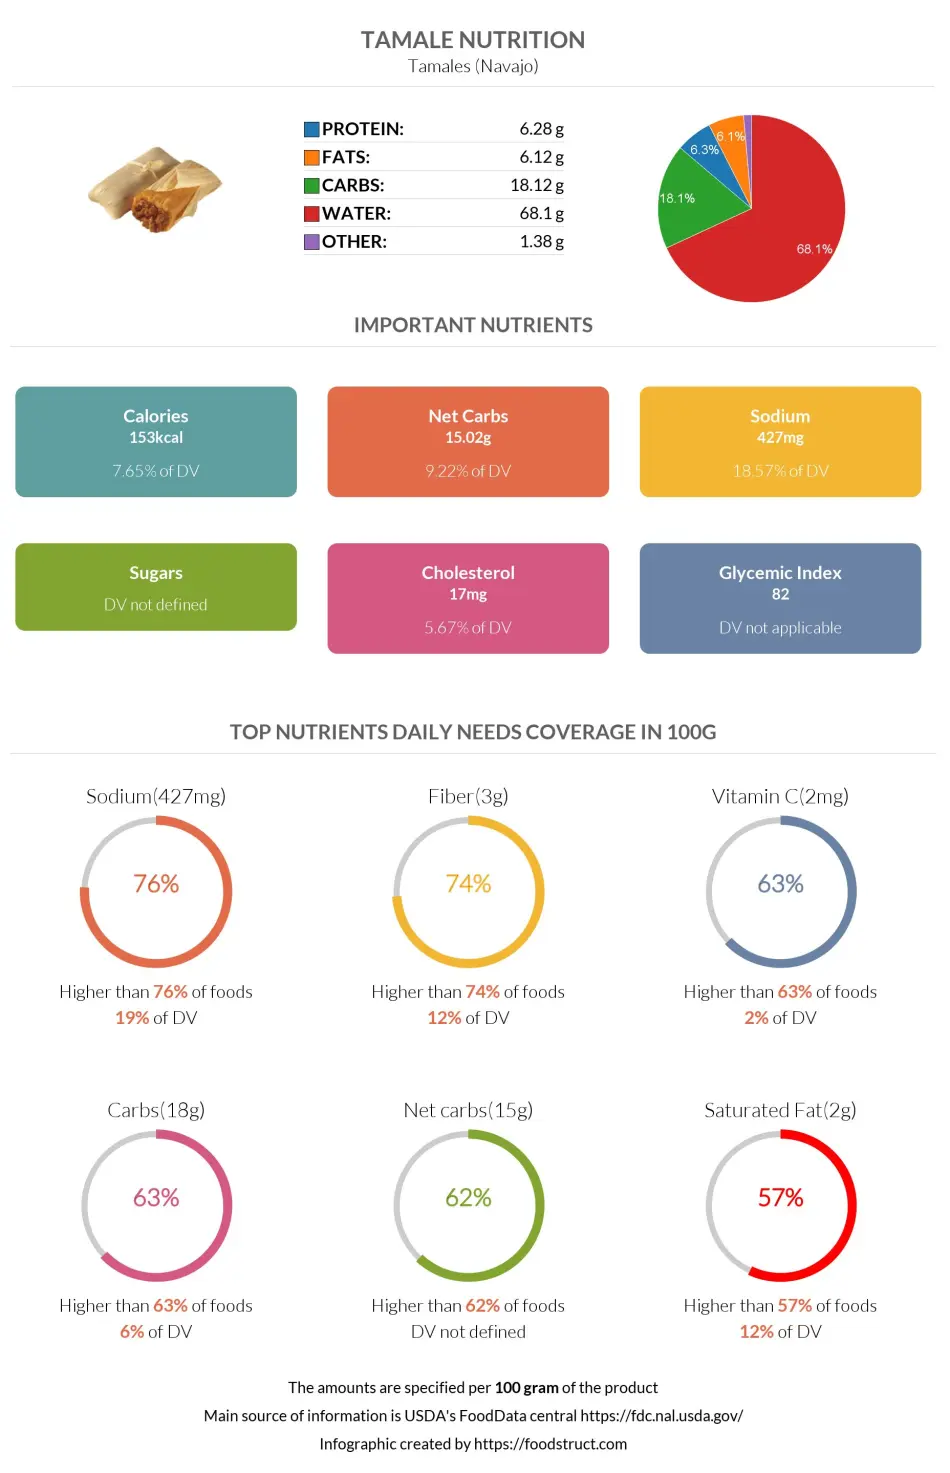
Tamale nutrition: calories, carbs, GI, protein, fiber, fats
Carbs in Tamale
Tamale is a Mexican-American dish made of corn dough and a banana leaf or corn husk. If the water content is removed, this food is primarily composed of carbs.
In 100g of Tamale, there are 18.1g of carbohydrates. In the chart shown below, you can analyze the macronutrient composition of tamales.
Macronutrients chart
Tamale provides 6% of the DV of carbs. It is higher in carbs than 63% of the other foods.
Carbs per serving size
Tamale is served in one piece, equivalent to 186 grams.
One serving of Tamale contains 33.7g of carbs.
Carbohydrate type breakdown
Most carbs in Tamale are starch, equalling 12.3 grams. There are also 1g of sugars, composed of maltose, glucose, and fructose.
Carbohydrate type breakdown
Fiber distribution in Tamale
In this food, 3.1g of all carbs are fibers. This food is rich in both soluble and insoluble fiber. Therefore, it can help maintain a healthy digestive and cardiovascular health.
Fiber content ratio for Tamale
Tamale net carbs
This dish provides 18.1g of total carbs, 3.1g of which are fibers.
Hence, the net carb content of Tamale equals 15g.

Top nutrition facts for Tamale
| Calories ⓘ Calories for selected serving | 153 kcal |
|
Glycemic index ⓘ
Source:
Check out our Glycemic index chart page for the full list.
|
82 (high) |
| Glycemic load ⓘ Glycemic Load (GL) is a metric that measures both the quality (Glycemic Index) and quantity of carbohydrates in a specific serving of food to estimate its impact on blood sugar levels. It is calculated as: (GI × Carbs in grams) / 100. | 23 (high) |
| Net carbs ⓘ Net Carbs = Total Carbohydrates – Fiber – Sugar Alcohols | 15 g |
| Default serving size ⓘ Serving sizes are mostly taken from FDA's Reference Amounts Customarily Consumed (RACCs) | 1 piece (186 g) |
| Acidity (Based on PRAL) ⓘ PRAL (Potential renal acid load) is calculated using a formula. On the PRAL scale the higher the positive value, the more is the acidifying effect on the body. The lower the negative value, the higher the alkalinity of the food. 0 is neutral. | 3 (acidic) |
Tamale calories (kcal)
| Calories for different serving sizes of tamale | Calories | Weight |
|---|---|---|
| Calories in 100 grams | 153 | |
| Calories in 1 piece | 285 | 186 g |
| Calories for different varieties of tamale | Calories | Weight |
|---|---|---|
| Tamales (Navajo) (this food) | 153 | 100 g |
| Tamales, masa and pork filling (Hopi) | 168 | 100 g |
Extra Nutrition facts for Tamale
| Protein per 100 calories ⓘ Shows how many grams of protein you get from 100 calories of this food, calculated as (protein in g ÷ calories) × 100. | 4.1 g |
| Calories per 10 g protein ⓘ Shows how many calories you need to eat from this food to get 10 g of protein, calculated as (calories ÷ protein in g) × 10. | 244 kcal |
| Weight per 100 calories ⓘ Shows how many grams of this food equal 100 kcal—higher grams mean a larger portion for the same calories. | 65 g |
| Unsaturated / Saturated Fat ratio ⓘ (monounsaturated + polyunsaturated) / saturated, ≥2 broadly recommended by major guidelines for heart health | 1.4 |
Tamale Glycemic index (GI)
Tamale Glycemic load (GL)
Mineral coverage chart
Mineral chart - relative view
Vitamin coverage chart
Vitamin chart - relative view
Protein quality breakdown
Fat type information
All nutrients for Tamale per 100g
| Nutrient | Value | DV% | In TOP % of foods | Comparison |
| Vitamin A | 0µg | 0% | 100% | |
| Calories | 153kcal | 8% | 59% |
3.3 times more than Orange
|
| Protein | 6.3g | 15% | 57% |
2.2 times more than Broccoli
|
| Protein per 100 calories | 4.1g | N/A | 51% | |
| Calories per 10 g protein | 244kcal | N/A | 46% | |
| Weight per 100 calories | 65g | N/A | 41% | |
| Unsaturated / Saturated Fat ratio | 1.4 | N/A | 59% | |
| Fats | 6.1g | 9% | 47% |
5.4 times less than Cheese
|
| Vitamin C | 1.7mg | 2% | 29% |
31.2 times less than Lemon
|
| Carbs | 18g | 6% | 38% |
1.6 times less than Rice
|
| Net carbs | 15g | N/A | 38% |
3.6 times less than Chocolate
|
| Cholesterol | 17mg | 6% | 40% |
21.9 times less than Egg
|
| Magnesium | 22mg | 5% | 46% |
6.4 times less than Almonds
|
| Calcium | 29mg | 3% | 41% |
4.3 times less than Milk
|
| Potassium | 131mg | 4% | 71% |
1.1 times less than Cucumber
|
| Iron | 1.2mg | 15% | 53% |
2.1 times less than Beef broiled
|
| Sugar | 0.99g | N/A | 46% |
9.1 times less than Coca-Cola
|
| Fiber | 3.1g | 12% | 20% |
1.3 times more than Orange
|
| Copper | 0.06mg | 7% | 60% |
2.3 times less than Shiitake
|
| Zinc | 1.5mg | 13% | 38% |
4.3 times less than Beef broiled
|
| Starch | 12g | 5% | 7% |
1.2 times less than Potato
|
| Phosphorus | 99mg | 14% | 58% |
1.8 times less than Chicken meat
|
| Sodium | 427mg | 19% | 24% |
1.1 times less than White bread
|
| Vitamin E | 0mg | 0% | 100% |
N/A
|
| Manganese | 0.17mg | 8% | 30% | |
| Selenium | 6µg | 11% | 47% | |
| Vitamin B1 | 0.05mg | 4% | 66% |
5.3 times less than Pea raw
|
| Vitamin B2 | 0.08mg | 6% | 67% |
1.6 times less than Avocado
|
| Vitamin B3 | 1.6mg | 10% | 55% |
6 times less than Turkey meat
|
| Vitamin B5 | 0.21mg | 4% | 56% |
5.5 times less than Sunflower seeds
|
| Vitamin B6 | 0.14mg | 11% | 46% |
1.2 times more than Oats
|
| Vitamin B12 | 0.54µg | 23% | 35% |
1.3 times less than Pork
|
| Folate | 15µg | 4% | 39% |
4.1 times less than Brussels sprouts
|
| Saturated fat | 2.4g | 12% | 40% |
2.5 times less than Beef broiled
|
| Monounsaturated fat | 2.7g | N/A | 39% |
3.6 times less than Avocado
|
| Polyunsaturated fat | 0.69g | N/A | 47% |
68.6 times less than Walnut
|
| Tryptophan | 0.05mg | 0% | 44% |
5.9 times less than Chicken meat
|
| Threonine | 0.24mg | 0% | 41% |
3 times less than Beef broiled
|
| Isoleucine | 0.27mg | 0% | 41% |
3.4 times less than Salmon raw
|
| Leucine | 0.57mg | 0% | 40% |
4.3 times less than Tuna Bluefin
|
| Lysine | 0.43mg | 0% | 37% |
1.1 times less than Tofu
|
| Methionine | 0.15mg | 0% | 38% |
1.6 times more than Quinoa
|
| Phenylalanine | 0.28mg | 0% | 42% |
2.4 times less than Egg
|
| Valine | 0.32mg | 0% | 42% |
6.4 times less than Soybean raw
|
| Histidine | 0.2mg | 0% | 39% |
3.8 times less than Turkey meat
|
| Fructose | 0.17g | 0% | 12% |
34.7 times less than Apple
|
| Omega-3 - ALA | 0.03g | N/A | 15% |
315.2 times less than Canola oil
|
| Omega-6 - Gamma-linoleic acid | 0g | N/A | 100% | |
| Omega-6 - Eicosadienoic acid | 0g | N/A | 100% |
Check out similar food or compare with current

NUTRITION FACTS LABEL
Serving Size ______________
Health checks
Tamale nutrition infographic
References
All the values for which the sources are not specified explicitly are taken from FDA’s Food Central. The exact link to the food presented on this page can be found below.