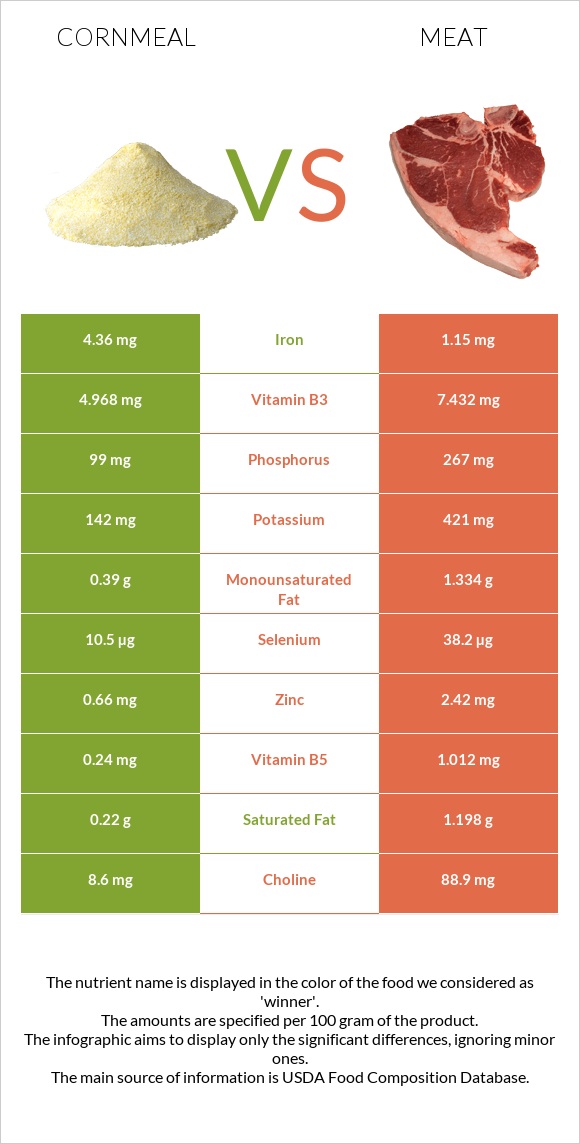
Summary of differences between cornmeal and pork Meat Cornmeal has more folate, iron, and fiber, while pork Meat has more selenium, vitamin B6, vitamin B1, phosphorus, vitamin B12, and zinc. Cornmeal covers your daily need for folate, 52% more than pork Meat. Pork Meat has a lower glycemic index. The glycemic index of pork Meat is 0, while the glycemic index of cornmeal is 68. These are the specific foods used in this comparison Cornmeal, degermed, enriched, yellow and Pork, fresh, loin, tenderloin, separable lean only, cooked, roasted .
Infographic
Mineral Comparison
Mineral comparison score is based on the number of minerals by which one or the other food is richer. The "coverage" charts below show how much of the daily needs can be covered by 300 grams of the food.
3
100 g
300 g
1 cup - 157g
Magnesium
Magnesium
Calcium
Calcium
Potassium
Potassium
Iron
Iron
Copper
Copper
Zinc
Zinc
Phosphorus
Phosphorus
Sodium
Sodium
Manganese
Manganese
Selenium
Selenium
23%
0.9%
13%
164%
25%
18%
42%
0.91%
23%
57%
6
100 g
300 g
3 oz - 85g 1 piece, cooked, excluding refuse (yield from 1 lb raw meat with refuse) - 333g 1 roast - 402g
Magnesium
Magnesium
Calcium
Calcium
Potassium
Potassium
Iron
Iron
Copper
Copper
Zinc
Zinc
Phosphorus
Phosphorus
Sodium
Sodium
Manganese
Manganese
Selenium
Selenium
21%
1.8%
37%
43%
37%
66%
114%
7.4%
1.7%
208%
Vitamin Comparison
Vitamin comparison score is based on the number of vitamins by which one or the other food is richer. The "coverage" charts below show how much of the daily needs can be covered by 300 grams of the food.
3
100 g
300 g
1 cup - 157g
Vitamin C
Vit. C
Vitamin D
Vit. D
Vitamin A
Vit. A
Vitamin E
Vit. E
Vitamin B1
Vit. B1
Vitamin B2
Vit. B2
Vitamin B3
Vit. B3
Vitamin B5
Vit. B5
Vitamin B6
Vit. B6
Vitamin B12
Vit. B12
Vitamin K
Vit. K
Folate
Folate
0%
0%
3.7%
2.4%
138%
88%
93%
14%
42%
0%
0%
157%
6
100 g
300 g
3 oz - 85g 1 piece, cooked, excluding refuse (yield from 1 lb raw meat with refuse) - 333g 1 roast - 402g
Vitamin C
Vit. C
Vitamin D
Vit. D
Vitamin A
Vit. A
Vitamin E
Vit. E
Vitamin B1
Vit. B1
Vitamin B2
Vit. B2
Vitamin B3
Vit. B3
Vitamin B5
Vit. B5
Vitamin B6
Vit. B6
Vitamin B12
Vit. B12
Vitamin K
Vit. K
Folate
Folate
0%
3%
0%
1.6%
238%
89%
139%
61%
171%
71%
0%
0%
All nutrients comparison - raw data values
Nutrient
DV% diff.
Folate
209µg
0µg
52%
Selenium
10.5µg
38.2µg
50%
Vitamin B6
0.182mg
0.739mg
43%
Iron
4.36mg
1.15mg
40%
Protein
7.11g
26.17g
38%
Vitamin B1
0.551mg
0.95mg
33%
Starch
73.3g
30%
Carbs
79.45g
0g
26%
Cholesterol
0mg
73mg
24%
Phosphorus
99mg
267mg
24%
Vitamin B12
0µg
0.57µg
24%
Fiber
3.9g
0g
16%
Zinc
0.66mg
2.42mg
16%
Vitamin B3
4.968mg
7.432mg
15%
Vitamin B5
0.24mg
1.012mg
15%
Choline
8.6mg
88.9mg
15%
Calories
370kcal
143kcal
11%
Potassium
142mg
421mg
8%
Manganese
0.174mg
0.013mg
7%
Copper
0.076mg
0.111mg
4%
Saturated fat
0.22g
1.198g
4%
Fats
1.75g
3.51g
3%
Sodium
7mg
57mg
2%
Monounsaturated fat
0.39g
1.334g
2%
Polyunsaturated fat
0.828g
0.506g
2%
Vitamin D*
0 IU
10 IU
1%
Vitamin D
0µg
0.2µg
1%
Magnesium
32mg
29mg
1%
Vitamin A
11µg
0µg
1%
Protein per 100 calories
1.9g
18g
N/A
Calories per 10 g protein
520kcal
55kcal
N/A
Weight per 100 calories
27g
70g
N/A
Unsaturated / Saturated Fat ratio
5.5
1.5
N/A
Net carbs
75.55g
0g
N/A
Calcium
3mg
6mg
0%
Sugar
1.61g
0g
N/A
Vitamin E
0.12mg
0.08mg
0%
Vitamin B2
0.382mg
0.387mg
0%
Trans fat
0g
0.033g
N/A
Tryptophan
0.038mg
0.275mg
0%
Threonine
0.172mg
1.175mg
0%
Isoleucine
0.242mg
1.288mg
0%
Leucine
1.006mg
2.229mg
0%
Lysine
0.105mg
2.427mg
0%
Methionine
0.162mg
0.721mg
0%
Phenylalanine
0.366mg
1.1mg
0%
Valine
0.337mg
1.367mg
0%
Histidine
0.172mg
1.13mg
0%
Fructose
0.17g
0%
Omega-3 - ALA
0.013g
N/A
Omega-6 - Eicosadienoic acid
0g
0.013g
N/A
Omega-6 - Linoleic acid
0.411g
N/A
Macronutrient Comparison
Macronutrient breakdown side-by-side comparison
1
7%
2%
79%
11%
Protein:
7.11 g
Fats:
1.75 g
Carbs:
79.45 g
Water:
11.18 g
Other:
0.51 g
4
26%
4%
69%
Protein:
26.17 g
Fats:
3.51 g
Carbs:
0 g
Water:
69.45 g
Other:
0.87 g
Contains
more
Carbs Carbs
+∞%
Contains
more
Protein Protein
+268.1%
Contains
more
Fats Fats
+100.6%
Contains
more
Water Water
+521.2%
Contains
more
Other Other
+70.6%
Fat Type Comparison
Fat type breakdown side-by-side comparison
2
15%
27%
58%
Saturated fat:
Sat. Fat
0.22 g
Monounsaturated fat:
Mono. Fat
0.39 g
Polyunsaturated fat:
Poly. Fat
0.828 g
1
39%
44%
17%
Saturated fat:
Sat. Fat
1.198 g
Monounsaturated fat:
Mono. Fat
1.334 g
Polyunsaturated fat:
Poly. Fat
0.506 g
Contains
less
Sat. Fat Saturated fat
-81.6%
Contains
more
Poly. Fat Polyunsaturated fat
+63.6%
Contains
more
Mono. Fat Monounsaturated fat
+242.1%