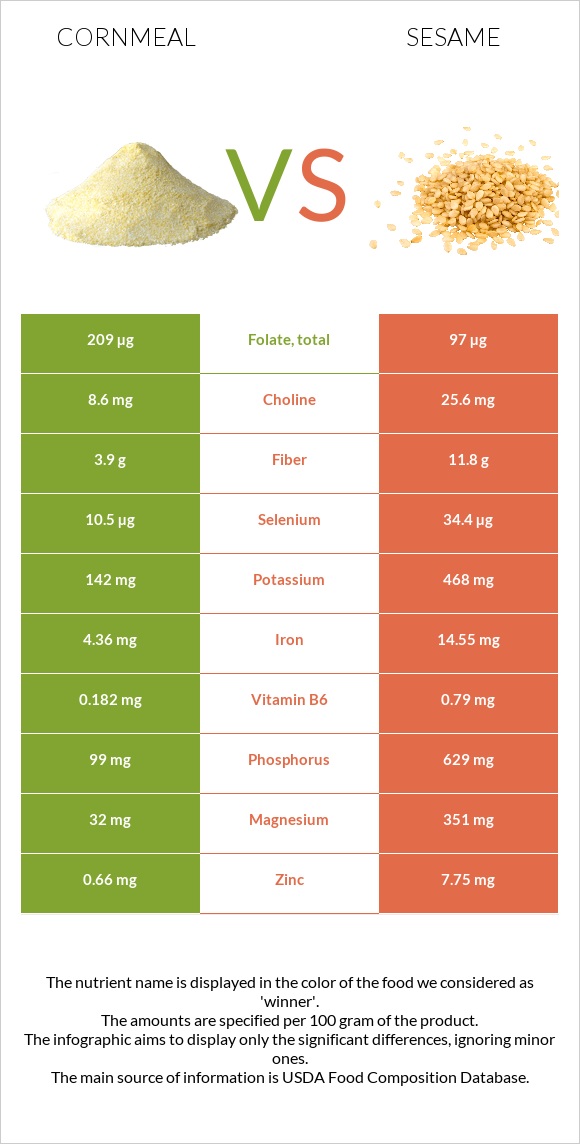
A recap on the differences between cornmeal and sesame Cornmeal has less copper, iron, manganese, calcium, magnesium, phosphorus, zinc, vitamin B6, and selenium. Sesame covers your daily copper needs 445% more than cornmeal. Cornmeal has less saturated fat. Food varieties used in this article are Cornmeal, degermed, enriched, yellow and Seeds, sesame seeds, whole, dried .
Infographic
Mineral Comparison
Mineral comparison score is based on the number of minerals by which one or the other food is richer. The "coverage" charts below show how much of the daily needs can be covered by 300 grams of the food.
1
100 g
300 g
1 cup - 157g
Magnesium
Magnesium
Calcium
Calcium
Potassium
Potassium
Iron
Iron
Copper
Copper
Zinc
Zinc
Phosphorus
Phosphorus
Sodium
Sodium
Manganese
Manganese
Selenium
Selenium
23%
0.9%
13%
164%
25%
18%
42%
0.91%
23%
57%
9
100 g
300 g
1 tbsp - 9g 1 cup - 144g
Magnesium
Magnesium
Calcium
Calcium
Potassium
Potassium
Iron
Iron
Copper
Copper
Zinc
Zinc
Phosphorus
Phosphorus
Sodium
Sodium
Manganese
Manganese
Selenium
Selenium
251%
293%
41%
546%
1361%
211%
270%
1.4%
321%
188%
Vitamin Comparison
Vitamin comparison score is based on the number of vitamins by which one or the other food is richer. The "coverage" charts below show how much of the daily needs can be covered by 300 grams of the food.
4
100 g
300 g
1 cup - 157g
Vitamin C
Vit. C
Vitamin D
Vit. D
Vitamin A
Vit. A
Vitamin E
Vit. E
Vitamin B1
Vit. B1
Vitamin B2
Vit. B2
Vitamin B3
Vit. B3
Vitamin B5
Vit. B5
Vitamin B6
Vit. B6
Vitamin B12
Vit. B12
Vitamin K
Vit. K
Folate
Folate
0%
0%
3.7%
2.4%
138%
88%
93%
14%
42%
0%
0%
157%
3
100 g
300 g
1 tbsp - 9g 1 cup - 144g
Vitamin C
Vit. C
Vitamin D
Vit. D
Vitamin A
Vit. A
Vitamin E
Vit. E
Vitamin B1
Vit. B1
Vitamin B2
Vit. B2
Vitamin B3
Vit. B3
Vitamin B5
Vit. B5
Vitamin B6
Vit. B6
Vitamin B12
Vit. B12
Vitamin K
Vit. K
Folate
Folate
0%
0%
0%
5%
198%
57%
85%
3%
182%
0%
0%
73%
All nutrients comparison - raw data values
Nutrient
DV% diff.
Copper
0.076mg
4.082mg
445%
Polyunsaturated fat
0.828g
21.773g
140%
Iron
4.36mg
14.55mg
127%
Manganese
0.174mg
2.46mg
99%
Calcium
3mg
975mg
97%
Magnesium
32mg
351mg
76%
Phosphorus
99mg
629mg
76%
Fats
1.75g
49.67g
74%
Zinc
0.66mg
7.75mg
64%
Vitamin B6
0.182mg
0.79mg
47%
Monounsaturated fat
0.39g
18.759g
46%
Selenium
10.5µg
34.4µg
43%
Fiber
3.9g
11.8g
32%
Saturated fat
0.22g
6.957g
31%
Starch
73.3g
30%
Folate
209µg
97µg
28%
Protein
7.11g
17.73g
21%
Vitamin B1
0.551mg
0.791mg
20%
Carbs
79.45g
23.45g
19%
Calories
370kcal
573kcal
10%
Potassium
142mg
468mg
10%
Vitamin B2
0.382mg
0.247mg
10%
Vitamin B5
0.24mg
0.05mg
4%
Vitamin B3
4.968mg
4.515mg
3%
Choline
8.6mg
25.6mg
3%
Vitamin A
11µg
0µg
1%
Vitamin E
0.12mg
0.25mg
1%
Protein per 100 calories
1.9g
3.1g
N/A
Calories per 10 g protein
520kcal
323kcal
N/A
Weight per 100 calories
27g
17g
N/A
Unsaturated / Saturated Fat ratio
5.5
5.8
N/A
Net carbs
75.55g
11.65g
N/A
Sugar
1.61g
0.3g
N/A
Sodium
7mg
11mg
0%
Tryptophan
0.038mg
0.388mg
0%
Threonine
0.172mg
0.736mg
0%
Isoleucine
0.242mg
0.763mg
0%
Leucine
1.006mg
1.358mg
0%
Lysine
0.105mg
0.569mg
0%
Methionine
0.162mg
0.586mg
0%
Phenylalanine
0.366mg
0.94mg
0%
Valine
0.337mg
0.99mg
0%
Histidine
0.172mg
0.522mg
0%
Fructose
0.17g
0%
Macronutrient Comparison
Macronutrient breakdown side-by-side comparison
2
7%
2%
79%
11%
Protein:
7.11 g
Fats:
1.75 g
Carbs:
79.45 g
Water:
11.18 g
Other:
0.51 g
3
18%
50%
23%
5%
4%
Protein:
17.73 g
Fats:
49.67 g
Carbs:
23.45 g
Water:
4.69 g
Other:
4.46 g
Contains
more
Carbs Carbs
+238.8%
Contains
more
Water Water
+138.4%
Contains
more
Protein Protein
+149.4%
Contains
more
Fats Fats
+2738.3%
Contains
more
Other Other
+774.5%
Fat Type Comparison
Fat type breakdown side-by-side comparison
1
15%
27%
58%
Saturated fat:
Sat. Fat
0.22 g
Monounsaturated fat:
Mono. Fat
0.39 g
Polyunsaturated fat:
Poly. Fat
0.828 g
2
15%
40%
46%
Saturated fat:
Sat. Fat
6.957 g
Monounsaturated fat:
Mono. Fat
18.759 g
Polyunsaturated fat:
Poly. Fat
21.773 g
Contains
less
Sat. Fat Saturated fat
-96.8%
Contains
more
Mono. Fat Monounsaturated fat
+4710%
Contains
more
Poly. Fat Polyunsaturated fat
+2529.6%