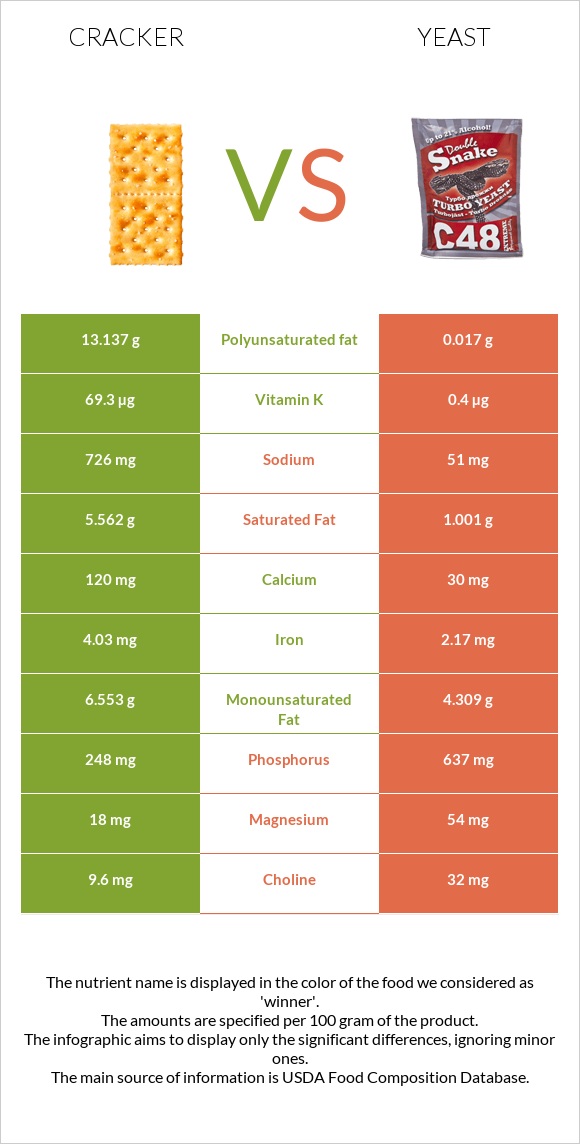
The main differences between crackers and yeast Crackers are richer in vitamin K, yet yeast is richer in vitamin B1, folate, vitamin B2, vitamin B5, vitamin B3, vitamin B6, fiber, zinc, and phosphorus. Daily need coverage for vitamin B1 for yeast is 881% higher. Crackers contain 173 times more vitamin K than yeast. Crackers contain 69.3µg of vitamin K, while yeast contains 0.4µg. Food types used in this article are Crackers, standard snack-type, regular and Leavening agents, yeast, baker's, active dry .
Infographic
Mineral Comparison
Mineral comparison score is based on the number of minerals by which one or the other food is richer. The "coverage" charts below show how much of the daily needs can be covered by 300 grams of the food.
3
100 g
300 g
1 cracker, round - 3.2g 1 cracker, rectangular - 4g 5 crackers - 16g 5 crackers, regular size, round (1 serving) - 16g 1 cup crushed - 52g
Magnesium
Magnesium
Calcium
Calcium
Potassium
Potassium
Iron
Iron
Copper
Copper
Zinc
Zinc
Phosphorus
Phosphorus
Sodium
Sodium
Manganese
Manganese
Selenium
Selenium
13%
36%
10%
151%
35%
13%
106%
95%
64%
37%
7
100 g
300 g
1 tsp - 4g 1 packet - 7.2g 1 tbsp - 12g
Magnesium
Magnesium
Calcium
Calcium
Potassium
Potassium
Iron
Iron
Copper
Copper
Zinc
Zinc
Phosphorus
Phosphorus
Sodium
Sodium
Manganese
Manganese
Selenium
Selenium
39%
9%
84%
81%
145%
217%
273%
6.7%
41%
43%
Vitamin Comparison
Vitamin comparison score is based on the number of vitamins by which one or the other food is richer. The "coverage" charts below show how much of the daily needs can be covered by 300 grams of the food.
2
100 g
300 g
1 cracker, round - 3.2g 1 cracker, rectangular - 4g 5 crackers - 16g 5 crackers, regular size, round (1 serving) - 16g 1 cup crushed - 52g
Vitamin C
Vit. C
Vitamin D
Vit. D
Vitamin A
Vit. A
Vitamin E
Vit. E
Vitamin B1
Vit. B1
Vitamin B2
Vit. B2
Vitamin B3
Vit. B3
Vitamin B5
Vit. B5
Vitamin B6
Vit. B6
Vitamin B12
Vit. B12
Vitamin K
Vit. K
Folate
Folate
0%
0%
0%
61%
104%
105%
82%
25%
15%
0%
173%
69%
8
100 g
300 g
1 tsp - 4g 1 packet - 7.2g 1 tbsp - 12g
Vitamin C
Vit. C
Vitamin D
Vit. D
Vitamin A
Vit. A
Vitamin E
Vit. E
Vitamin B1
Vit. B1
Vitamin B2
Vit. B2
Vitamin B3
Vit. B3
Vitamin B5
Vit. B5
Vitamin B6
Vit. B6
Vitamin B12
Vit. B12
Vitamin K
Vit. K
Folate
Folate
1%
0%
0%
0%
2748%
923%
754%
810%
346%
8.8%
1%
1755%
All nutrients comparison - raw data values
Nutrient
DV% diff.
Vitamin B1
0.416mg
10.99mg
881%
Folate
92µg
2340µg
562%
Vitamin B2
0.456mg
4mg
273%
Vitamin B5
0.417mg
13.5mg
262%
Vitamin B3
4.352mg
40.2mg
224%
Vitamin B6
0.063mg
1.5mg
111%
Fiber
2.3g
26.9g
98%
Polyunsaturated fat
13.137g
0.017g
87%
Protein
6.64g
40.44g
68%
Zinc
0.49mg
7.94mg
68%
Vitamin K
69.3µg
0.4µg
57%
Phosphorus
248mg
637mg
56%
Copper
0.104mg
0.436mg
37%
Fats
26.43g
7.61g
29%
Sodium
726mg
51mg
29%
Potassium
118mg
955mg
25%
Iron
4.03mg
2.17mg
23%
Saturated fat
5.562g
1.001g
21%
Starch
49.69g
20%
Vitamin E
3.03mg
0mg
20%
Calories
510kcal
325kcal
9%
Magnesium
18mg
54mg
9%
Calcium
120mg
30mg
9%
Manganese
0.491mg
0.312mg
8%
Carbs
61.3g
41.22g
7%
Monounsaturated fat
6.553g
4.309g
6%
Choline
9.6mg
32mg
4%
Vitamin B12
0µg
0.07µg
3%
Selenium
6.7µg
7.9µg
2%
Protein per 100 calories
1.3g
12g
N/A
Calories per 10 g protein
768kcal
80kcal
N/A
Weight per 100 calories
20g
31g
N/A
Unsaturated / Saturated Fat ratio
3.5
4.3
N/A
Vitamin C
0mg
0.3mg
0%
Net carbs
59g
14.32g
N/A
Sugar
8.18g
0g
N/A
Trans fat
1.076g
N/A
Tryptophan
0.084mg
0.54mg
0%
Threonine
0.193mg
1.99mg
0%
Isoleucine
0.246mg
1.89mg
0%
Leucine
0.471mg
2.92mg
0%
Lysine
0.103mg
3.28mg
0%
Methionine
0.112mg
0.59mg
0%
Phenylalanine
0.331mg
1.75mg
0%
Valine
0.294mg
2.31mg
0%
Histidine
0.145mg
0.91mg
0%
Fructose
0.29g
0%
Omega-3 - ALA
1.485g
N/A
Omega-6 - Gamma-linoleic acid
0.062g
N/A
Omega-6 - Eicosadienoic acid
0.009g
N/A
Omega-6 - Linoleic acid
11.48g
N/A
Macronutrient Comparison
Macronutrient breakdown side-by-side comparison
2
7%
26%
61%
3%
2%
Protein:
6.64 g
Fats:
26.43 g
Carbs:
61.3 g
Water:
3.14 g
Other:
2.49 g
3
40%
8%
41%
5%
6%
Protein:
40.44 g
Fats:
7.61 g
Carbs:
41.22 g
Water:
5.08 g
Other:
5.65 g
Contains
more
Fats Fats
+247.3%
Contains
more
Carbs Carbs
+48.7%
Contains
more
Protein Protein
+509%
Contains
more
Water Water
+61.8%
Contains
more
Other Other
+126.9%
Fat Type Comparison
Fat type breakdown side-by-side comparison
2
22%
26%
52%
Saturated fat:
Sat. Fat
5.562 g
Monounsaturated fat:
Mono. Fat
6.553 g
Polyunsaturated fat:
Poly. Fat
13.137 g
1
19%
81%
Saturated fat:
Sat. Fat
1.001 g
Monounsaturated fat:
Mono. Fat
4.309 g
Polyunsaturated fat:
Poly. Fat
0.017 g
Contains
more
Mono. Fat Monounsaturated fat
+52.1%
Contains
more
Poly. Fat Polyunsaturated fat
+77176.5%
Contains
less
Sat. Fat Saturated fat
-82%