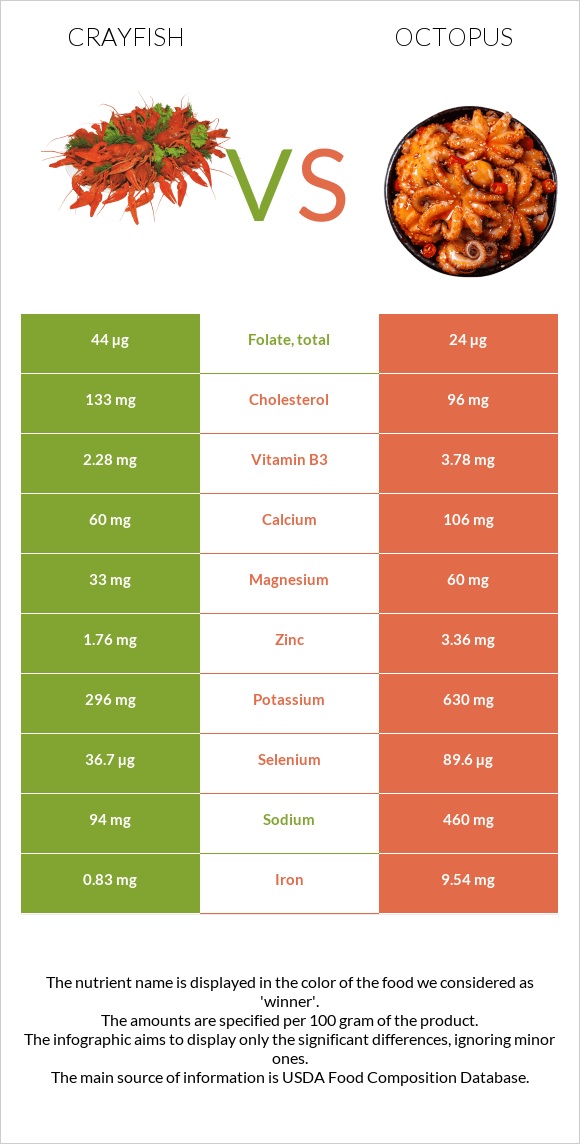
What are the main differences between crayfish and octopus? Crayfish is richer in manganese, yet octopus is richer in vitamin B12, iron, selenium, vitamin B6, zinc, potassium, and vitamin B3. Octopus's daily need coverage for vitamin B12 is 1410% higher. Crayfish has 11 times more manganese than octopus. Crayfish has 0.522mg of manganese, while octopus has 0.047mg. Octopus contains less cholesterol. We used Crustaceans, crayfish, mixed species, wild, cooked, moist heat and Mollusks, octopus, common, cooked, moist heat types in this comparison.
Infographic
Mineral Comparison
Mineral comparison score is based on the number of minerals by which one or the other food is richer. The "coverage" charts below show how much of the daily needs can be covered by 300 grams of the food.
2
100 g
300 g
3 oz - 85g
Magnesium
Magnesium
Calcium
Calcium
Potassium
Potassium
Iron
Iron
Copper
Copper
Zinc
Zinc
Phosphorus
Phosphorus
Sodium
Sodium
Manganese
Manganese
Selenium
Selenium
24%
18%
26%
31%
228%
48%
116%
12%
68%
200%
6
100 g
300 g
3 oz - 85g
Magnesium
Magnesium
Calcium
Calcium
Potassium
Potassium
Iron
Iron
Copper
Copper
Zinc
Zinc
Phosphorus
Phosphorus
Sodium
Sodium
Manganese
Manganese
Selenium
Selenium
43%
32%
56%
358%
246%
92%
120%
60%
6.1%
489%
Vitamin Comparison
Vitamin comparison score is based on the number of vitamins by which one or the other food is richer. The "coverage" charts below show how much of the daily needs can be covered by 300 grams of the food.
3
100 g
300 g
3 oz - 85g
Vitamin C
Vit. C
Vitamin D
Vit. D
Vitamin A
Vit. A
Vitamin E
Vit. E
Vitamin B1
Vit. B1
Vitamin B2
Vit. B2
Vitamin B3
Vit. B3
Vitamin B5
Vit. B5
Vitamin B6
Vit. B6
Vitamin B12
Vit. B12
Vitamin K
Vit. K
Folate
Folate
3%
0%
5%
30%
13%
20%
43%
35%
18%
269%
0.25%
33%
7
100 g
300 g
3 oz - 85g
Vitamin C
Vit. C
Vitamin D
Vit. D
Vitamin A
Vit. A
Vitamin E
Vit. E
Vitamin B1
Vit. B1
Vitamin B2
Vit. B2
Vitamin B3
Vit. B3
Vitamin B5
Vit. B5
Vitamin B6
Vit. B6
Vitamin B12
Vit. B12
Vitamin K
Vit. K
Folate
Folate
27%
0%
30%
24%
14%
18%
71%
54%
150%
4500%
0.25%
18%
All nutrients comparison - raw data values
Nutrient
DV% diff.
Vitamin B12
2.15µg
36µg
1410%
Iron
0.83mg
9.54mg
109%
Selenium
36.7µg
89.6µg
96%
Vitamin B6
0.076mg
0.648mg
44%
Protein
16.77g
29.82g
26%
Manganese
0.522mg
0.047mg
21%
Sodium
94mg
460mg
16%
Zinc
1.76mg
3.36mg
15%
Cholesterol
133mg
96mg
12%
Potassium
296mg
630mg
10%
Vitamin B3
2.28mg
3.78mg
9%
Vitamin C
0.9mg
8mg
8%
Vitamin A
15µg
90µg
8%
Magnesium
33mg
60mg
6%
Copper
0.685mg
0.739mg
6%
Vitamin B5
0.58mg
0.9mg
6%
Calcium
60mg
106mg
5%
Folate
44µg
24µg
5%
Calories
82kcal
164kcal
4%
Vitamin E
1.5mg
1.2mg
2%
Fats
1.2g
2.08g
1%
Carbs
0g
4.4g
1%
Phosphorus
270mg
279mg
1%
Vitamin B1
0.05mg
0.057mg
1%
Vitamin B2
0.085mg
0.076mg
1%
Saturated fat
0.181g
0.453g
1%
Polyunsaturated fat
0.367g
0.477g
1%
Protein per 100 calories
20g
18g
N/A
Calories per 10 g protein
49kcal
55kcal
N/A
Weight per 100 calories
122g
61g
N/A
Unsaturated / Saturated Fat ratio
3.4
1.8
N/A
Net carbs
0g
4.4g
N/A
Vitamin K
0.1µg
0.1µg
0%
Choline
80.9mg
81mg
0%
Monounsaturated fat
0.244g
0.324g
0%
Tryptophan
0.234mg
0.334mg
0%
Threonine
0.676mg
1.283mg
0%
Isoleucine
0.811mg
1.298mg
0%
Leucine
1.329mg
2.099mg
0%
Lysine
1.457mg
2.228mg
0%
Methionine
0.472mg
0.673mg
0%
Phenylalanine
0.706mg
1.069mg
0%
Valine
0.786mg
1.303mg
0%
Histidine
0.341mg
0.573mg
0%
Omega-3 - EPA
0.119g
0.152g
N/A
Omega-3 - DHA
0.047g
0.162g
N/A
Omega-3 - DPA
0g
0.012g
N/A
Macronutrient Comparison
Macronutrient breakdown side-by-side comparison
1
17%
79%
3%
Protein:
16.77 g
Fats:
1.2 g
Carbs:
0 g
Water:
79.37 g
Other:
2.66 g
4
30%
2%
4%
61%
3%
Protein:
29.82 g
Fats:
2.08 g
Carbs:
4.4 g
Water:
60.5 g
Other:
3.2 g
Contains
more
Water Water
+31.2%
Contains
more
Protein Protein
+77.8%
Contains
more
Fats Fats
+73.3%
Contains
more
Carbs Carbs
+∞%
Contains
more
Other Other
+20.3%
Fat Type Comparison
Fat type breakdown side-by-side comparison
1
23%
31%
46%
Saturated fat:
Sat. Fat
0.181 g
Monounsaturated fat:
Mono. Fat
0.244 g
Polyunsaturated fat:
Poly. Fat
0.367 g
2
36%
26%
38%
Saturated fat:
Sat. Fat
0.453 g
Monounsaturated fat:
Mono. Fat
0.324 g
Polyunsaturated fat:
Poly. Fat
0.477 g
Contains
less
Sat. Fat Saturated fat
-60%
Contains
more
Mono. Fat Monounsaturated fat
+32.8%
Contains
more
Poly. Fat Polyunsaturated fat
+30%