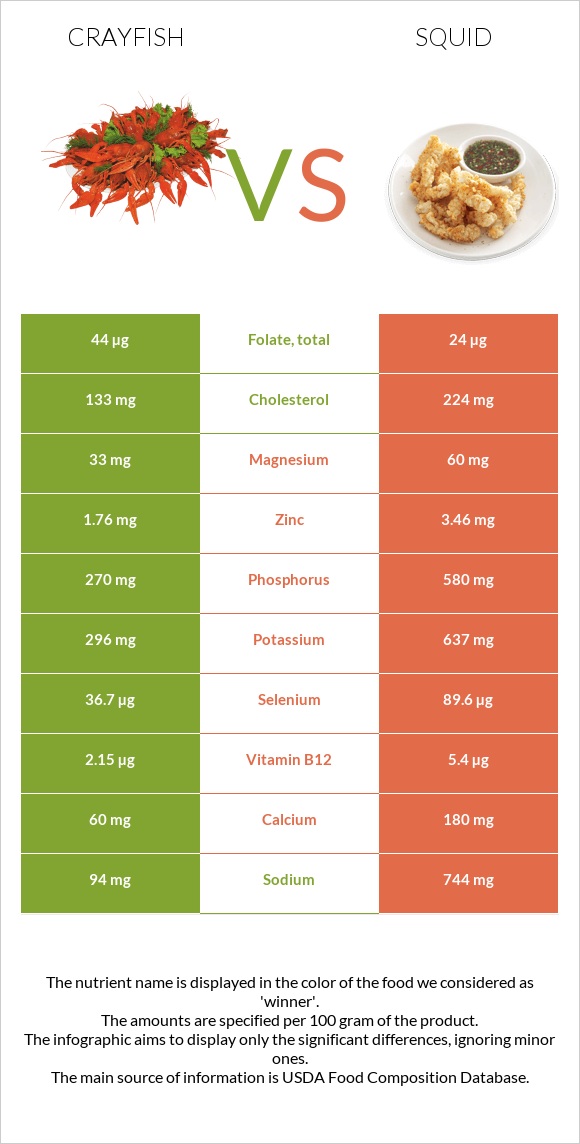
A recap on the differences between crayfish and squid Squid is higher than crayfish in vitamin B12, vitamin B2, iron, selenium, phosphorus, copper, zinc, and vitamin B6. Squid covers your daily vitamin B12 needs 135% more than crayfish. The amount of cholesterol in crayfish is lower. Food varieties used in this article are Crustaceans, crayfish, mixed species, wild, cooked, moist heat and Mollusks, cuttlefish, mixed species, cooked, moist heat .
Infographic
Mineral Comparison
Mineral comparison score is based on the number of minerals by which one or the other food is richer. The "coverage" charts below show how much of the daily needs can be covered by 300 grams of the food.
2
100 g
300 g
3 oz - 85g
Magnesium
Magnesium
Calcium
Calcium
Potassium
Potassium
Iron
Iron
Copper
Copper
Zinc
Zinc
Phosphorus
Phosphorus
Sodium
Sodium
Manganese
Manganese
Selenium
Selenium
24%
18%
26%
31%
228%
48%
116%
12%
68%
200%
8
100 g
300 g
3 oz - 85g
Magnesium
Magnesium
Calcium
Calcium
Potassium
Potassium
Iron
Iron
Copper
Copper
Zinc
Zinc
Phosphorus
Phosphorus
Sodium
Sodium
Manganese
Manganese
Selenium
Selenium
43%
54%
56%
407%
333%
94%
249%
97%
27%
489%
Vitamin Comparison
Vitamin comparison score is based on the number of vitamins by which one or the other food is richer. The "coverage" charts below show how much of the daily needs can be covered by 300 grams of the food.
4
100 g
300 g
3 oz - 85g
Vitamin C
Vit. C
Vitamin D
Vit. D
Vitamin A
Vit. A
Vitamin E
Vit. E
Vitamin B1
Vit. B1
Vitamin B2
Vit. B2
Vitamin B3
Vit. B3
Vitamin B5
Vit. B5
Vitamin B6
Vit. B6
Vitamin B12
Vit. B12
Vitamin K
Vit. K
Folate
Folate
3%
0%
5%
30%
13%
20%
43%
35%
18%
269%
0.25%
33%
6
100 g
300 g
3 oz - 85g
Vitamin C
Vit. C
Vitamin D
Vit. D
Vitamin A
Vit. A
Vitamin E
Vit. E
Vitamin B1
Vit. B1
Vitamin B2
Vit. B2
Vitamin B3
Vit. B3
Vitamin B5
Vit. B5
Vitamin B6
Vit. B6
Vitamin B12
Vit. B12
Vitamin K
Vit. K
Folate
Folate
28%
0%
68%
0%
4.3%
399%
41%
54%
62%
675%
0%
18%
All nutrients comparison - raw data values
Nutrient
DV% diff.
Vitamin B12
2.15µg
5.4µg
135%
Vitamin B2
0.085mg
1.729mg
126%
Iron
0.83mg
10.84mg
125%
Selenium
36.7µg
89.6µg
96%
Phosphorus
270mg
580mg
44%
Copper
0.685mg
0.998mg
35%
Protein
16.77g
32.48g
31%
Cholesterol
133mg
224mg
30%
Sodium
94mg
744mg
28%
Vitamin A
15µg
203µg
21%
Zinc
1.76mg
3.46mg
15%
Vitamin B6
0.076mg
0.27mg
15%
Choline
80.9mg
15%
Manganese
0.522mg
0.209mg
14%
Calcium
60mg
180mg
12%
Potassium
296mg
637mg
10%
Vitamin E
1.5mg
10%
Vitamin C
0.9mg
8.5mg
8%
Magnesium
33mg
60mg
6%
Vitamin B5
0.58mg
0.9mg
6%
Folate
44µg
24µg
5%
Calories
82kcal
158kcal
4%
Vitamin B1
0.05mg
0.017mg
3%
Carbs
0g
1.64g
1%
Vitamin B3
2.28mg
2.189mg
1%
Polyunsaturated fat
0.367g
0.268g
1%
Protein per 100 calories
20g
21g
N/A
Calories per 10 g protein
49kcal
49kcal
N/A
Weight per 100 calories
122g
63g
N/A
Fats
1.2g
1.4g
0%
Net carbs
0g
1.64g
N/A
Vitamin K
0.1µg
0%
Saturated fat
0.181g
0.236g
0%
Monounsaturated fat
0.244g
0.162g
0%
Tryptophan
0.234mg
0.364mg
0%
Threonine
0.676mg
1.398mg
0%
Isoleucine
0.811mg
1.414mg
0%
Leucine
1.329mg
2.287mg
0%
Lysine
1.457mg
2.427mg
0%
Methionine
0.472mg
0.733mg
0%
Phenylalanine
0.706mg
1.164mg
0%
Valine
0.786mg
1.419mg
0%
Histidine
0.341mg
0.624mg
0%
Omega-3 - EPA
0.119g
0.078g
N/A
Omega-3 - DHA
0.047g
0.132g
N/A
Omega-3 - DPA
0g
0.012g
N/A
Macronutrient Comparison
Macronutrient breakdown side-by-side comparison
1
17%
79%
3%
Protein:
16.77 g
Fats:
1.2 g
Carbs:
0 g
Water:
79.37 g
Other:
2.66 g
4
32%
61%
3%
Protein:
32.48 g
Fats:
1.4 g
Carbs:
1.64 g
Water:
61.12 g
Other:
3.36 g
Contains
more
Water Water
+29.9%
Contains
more
Protein Protein
+93.7%
Contains
more
Fats Fats
+16.7%
Contains
more
Carbs Carbs
+∞%
Contains
more
Other Other
+26.3%
Fat Type Comparison
Fat type breakdown side-by-side comparison
3
23%
31%
46%
Saturated fat:
Sat. Fat
0.181 g
Monounsaturated fat:
Mono. Fat
0.244 g
Polyunsaturated fat:
Poly. Fat
0.367 g
0
35%
24%
40%
Saturated fat:
Sat. Fat
0.236 g
Monounsaturated fat:
Mono. Fat
0.162 g
Polyunsaturated fat:
Poly. Fat
0.268 g
Contains
less
Sat. Fat Saturated fat
-23.3%
Contains
more
Mono. Fat Monounsaturated fat
+50.6%
Contains
more
Poly. Fat Polyunsaturated fat
+36.9%