Cream of Broccoli Soup vs. Wonton soup — In-Depth Nutrition Comparison
Compare
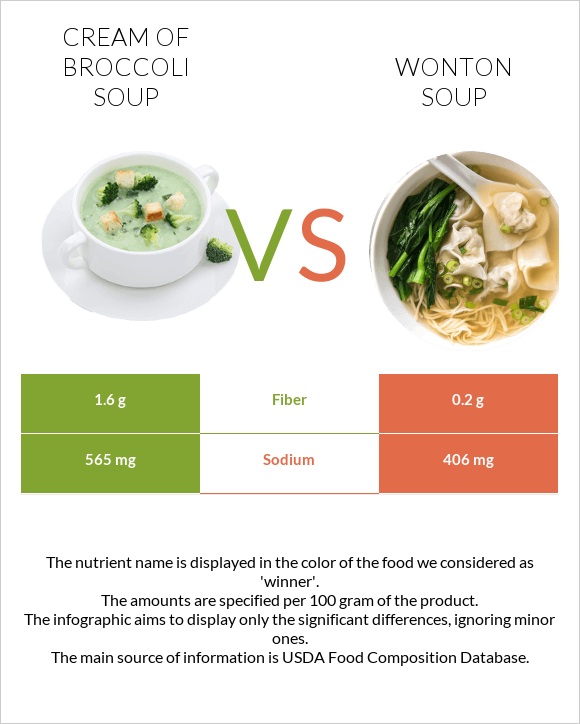
Differences between cream of Broccoli Soup and wonton soup
- Wonton soup contains less fiber than cream of Broccoli Soup.
- Wonton soup contains 8 times less fiber than cream of Broccoli Soup. Cream of Broccoli Soup contains 1.6g of fiber, while wonton soup contains 0.2g.
- The amount of sodium in wonton soup is lower.
The food types used in this comparison are CAMPBELL'S, 98% Fat Free Cream of Broccoli Soup, condensed and Soup, wonton, Chinese restaurant.
Infographic
Infographic link
Mineral Comparison
Mineral comparison score is based on the number of minerals by which one or the other food is richer. The "coverage" charts below show how much of the daily needs can be covered by 300 grams of the food.
| Contains more CalciumCalcium | +220% |
| Contains more IronIron | +∞% |
| Contains less SodiumSodium | -28.1% |
Vitamin Comparison
Vitamin comparison score is based on the number of vitamins by which one or the other food is richer. The "coverage" charts below show how much of the daily needs can be covered by 300 grams of the food.
| Contains more Vitamin CVitamin C | +∞% |
All nutrients comparison - raw data values
| Nutrient |  |
 |
DV% diff. |
| Sodium | 565mg | 406mg | 7% |
| Fiber | 1.6g | 0.2g | 6% |
| Vitamin B6 | 0.076mg | 6% | |
| Vitamin B3 | 0.58mg | 4% | |
| Vitamin B12 | 0.09µg | 4% | |
| Iron | 0mg | 0.21mg | 3% |
| Copper | 0.024mg | 3% | |
| Phosphorus | 18mg | 3% | |
| Vitamin B5 | 0.14mg | 3% | |
| Folate | 13µg | 3% | |
| Choline | 19mg | 3% | |
| Fats | 1.61g | 0.26g | 2% |
| Starch | 4.75g | 2% | |
| Selenium | 1.1µg | 2% | |
| Vitamin B1 | 0.024mg | 2% | |
| Saturated fat | 0.403g | 0.062g | 2% |
| Calories | 56kcal | 32kcal | 1% |
| Protein | 1.61g | 2.08g | 1% |
| Vitamin C | 0mg | 0.7mg | 1% |
| Carbs | 8.06g | 5.25g | 1% |
| Magnesium | 3mg | 1% | |
| Calcium | 16mg | 5mg | 1% |
| Potassium | 32mg | 1% | |
| Zinc | 0.12mg | 1% | |
| Manganese | 0.034mg | 1% | |
| Vitamin B2 | 0.016mg | 1% | |
| Vitamin K | 0.9µg | 1% | |
| Protein per 100 calories | 2.9g | 6.5g | N/A |
| Calories per 10 g protein | 348kcal | 154kcal | N/A |
| Weight per 100 calories | 179g | 313g | N/A |
| Net carbs | 6.46g | 5.05g | N/A |
| Cholesterol | 4mg | 4mg | 0% |
| Sugar | 0.81g | 0.34g | N/A |
| Vitamin A | 1µg | 0% | |
| Vitamin E | 0.06mg | 0% | |
| Trans fat | 0g | 0.001g | N/A |
| Monounsaturated fat | 0.077g | 0% | |
| Polyunsaturated fat | 0.071g | 0% | |
| Tryptophan | 0.013mg | 0% | |
| Threonine | 0.081mg | 0% | |
| Isoleucine | 0.06mg | 0% | |
| Leucine | 0.12mg | 0% | |
| Lysine | 0.062mg | 0% | |
| Methionine | 0.03mg | 0% | |
| Phenylalanine | 0.07mg | 0% | |
| Valine | 0.071mg | 0% | |
| Histidine | 0.039mg | 0% | |
| Omega-3 - ALA | 0.004g | N/A | |
| Omega-6 - Linoleic acid | 0.065g | N/A |
Macronutrient Comparison
Macronutrient breakdown side-by-side comparison
Protein:
1.61 g
Fats:
1.61 g
Carbs:
8.06 g
Water:
86.6 g
Other:
2.12 g
Protein:
2.08 g
Fats:
0.26 g
Carbs:
5.25 g
Water:
91.18 g
Other:
1.23 g
| Contains more FatsFats | +519.2% |
| Contains more CarbsCarbs | +53.5% |
| Contains more OtherOther | +72.4% |
| Contains more ProteinProtein | +29.2% |
~equal in
Water
~91.18g
Fat Type Comparison
Fat type breakdown side-by-side comparison
Saturated fat:
Sat. Fat
0.403 g
Monounsaturated fat:
Mono. Fat
0 g
Polyunsaturated fat:
Poly. Fat
0 g
Saturated fat:
Sat. Fat
0.062 g
Monounsaturated fat:
Mono. Fat
0.077 g
Polyunsaturated fat:
Poly. Fat
0.071 g
| Contains less Sat. FatSaturated fat | -84.6% |


