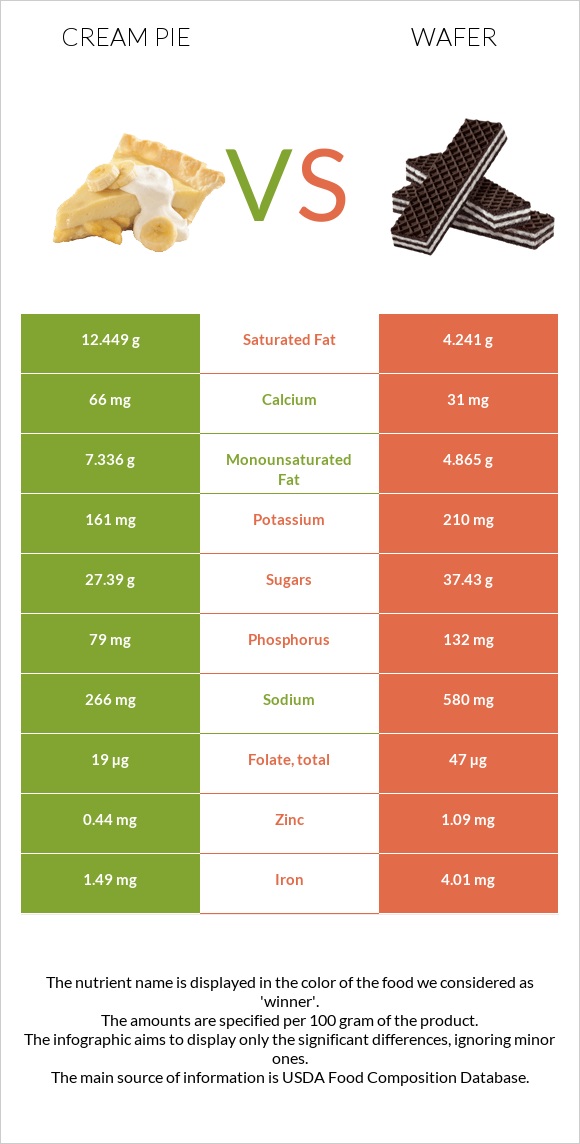
What are the differences between cream pie and wafer? Wafer is richer than cream pie in copper, iron, manganese, vitamin B3, fiber, vitamin B2, vitamin B1, and magnesium. Cream pie's daily need coverage for saturated fat is 41% more. The amount of saturated fat in wafer is lower. We used Pie, chocolate creme, commercially prepared and Cookies, chocolate wafers types in this article.
Infographic
Mineral Comparison
Mineral comparison score is based on the number of minerals by which one or the other food is richer. The "coverage" charts below show how much of the daily needs can be covered by 300 grams of the food.
2
100 g
300 g
1 oz - 28.35g 1 piece (1/4 of 6" pie) - 99g 1 piece (1/6 of 8" pie) - 113g 1 serving .167 pie - 120g
Magnesium
Magnesium
Calcium
Calcium
Potassium
Potassium
Iron
Iron
Copper
Copper
Zinc
Zinc
Phosphorus
Phosphorus
Sodium
Sodium
Manganese
Manganese
Selenium
Selenium
14%
20%
14%
56%
39%
12%
34%
35%
21%
33%
7
100 g
300 g
1 wafer - 6g 1 oz - 28.35g 1 cup, crumbs - 112g
Magnesium
Magnesium
Calcium
Calcium
Potassium
Potassium
Iron
Iron
Copper
Copper
Zinc
Zinc
Phosphorus
Phosphorus
Sodium
Sodium
Manganese
Manganese
Selenium
Selenium
38%
9.3%
19%
150%
154%
30%
57%
76%
91%
31%
Vitamin Comparison
Vitamin comparison score is based on the number of vitamins by which one or the other food is richer. The "coverage" charts below show how much of the daily needs can be covered by 300 grams of the food.
5
100 g
300 g
1 oz - 28.35g 1 piece (1/4 of 6" pie) - 99g 1 piece (1/6 of 8" pie) - 113g 1 serving .167 pie - 120g
Vitamin C
Vit. C
Vitamin D
Vit. D
Vitamin A
Vit. A
Vitamin E
Vit. E
Vitamin B1
Vit. B1
Vitamin B2
Vit. B2
Vitamin B3
Vit. B3
Vitamin B5
Vit. B5
Vitamin B6
Vit. B6
Vitamin B12
Vit. B12
Vitamin K
Vit. K
Folate
Folate
0%
1.5%
15%
22%
22%
32%
11%
14%
4.6%
15%
24%
14%
6
100 g
300 g
1 wafer - 6g 1 oz - 28.35g 1 cup, crumbs - 112g
Vitamin C
Vit. C
Vitamin D
Vit. D
Vitamin A
Vit. A
Vitamin E
Vit. E
Vitamin B1
Vit. B1
Vitamin B2
Vit. B2
Vitamin B3
Vit. B3
Vitamin B5
Vit. B5
Vitamin B6
Vit. B6
Vitamin B12
Vit. B12
Vitamin K
Vit. K
Folate
Folate
0%
0%
1%
14%
51%
61%
54%
23%
12%
11%
6%
35%
All nutrients comparison - raw data values
Nutrient
DV% diff.
Copper
0.118mg
0.463mg
38%
Saturated fat
12.449g
4.241g
37%
Iron
1.49mg
4.01mg
32%
Manganese
0.161mg
0.696mg
23%
Polyunsaturated fat
1.149g
4.153g
20%
Sodium
266mg
580mg
14%
Vitamin B3
0.605mg
2.858mg
14%
Fats
22.41g
14.2g
13%
Carbs
38.44g
72.7g
11%
Fiber
0.8g
3.4g
10%
Vitamin B1
0.087mg
0.203mg
10%
Vitamin B2
0.14mg
0.266mg
10%
Magnesium
19mg
53mg
8%
Phosphorus
79mg
132mg
8%
Folate
19µg
47µg
7%
Zinc
0.44mg
1.09mg
6%
Vitamin K
9.5µg
2.4µg
6%
Monounsaturated fat
7.336g
4.865g
6%
Protein
4.15g
6.6g
5%
Vitamin A
46µg
3µg
5%
Calories
353kcal
433kcal
4%
Calcium
66mg
31mg
4%
Cholesterol
12mg
2mg
3%
Vitamin B5
0.232mg
0.381mg
3%
Caffeine
0mg
10mg
3%
Vitamin E
1.09mg
0.72mg
2%
Vitamin B6
0.02mg
0.051mg
2%
Vitamin D
0.1µg
0µg
1%
Potassium
161mg
210mg
1%
Selenium
6µg
5.7µg
1%
Vitamin B12
0.12µg
0.09µg
1%
Choline
17.9mg
14.3mg
1%
Protein per 100 calories
1.2g
1.5g
N/A
Calories per 10 g protein
851kcal
656kcal
N/A
Weight per 100 calories
28g
23g
N/A
Unsaturated / Saturated Fat ratio
0.68
2.1
N/A
Net carbs
37.64g
69.3g
N/A
Vitamin D*
3 IU
0 IU
0%
Sugar
27.39g
37.43g
N/A
Trans fat
2.49g
N/A
Tryptophan
0.096mg
0%
Threonine
0.22mg
0%
Isoleucine
0.261mg
0%
Leucine
0.447mg
0%
Lysine
0.281mg
0%
Methionine
0.105mg
0%
Phenylalanine
0.308mg
0%
Valine
0.323mg
0%
Histidine
0.128mg
0%
Omega-3 - EPA
0.001g
0.003g
N/A
Omega-3 - DHA
0g
0.002g
N/A
Macronutrient Comparison
Macronutrient breakdown side-by-side comparison
2
4%
22%
38%
34%
Protein:
4.15 g
Fats:
22.41 g
Carbs:
38.44 g
Water:
33.92 g
Other:
1.08 g
3
7%
14%
73%
5%
2%
Protein:
6.6 g
Fats:
14.2 g
Carbs:
72.7 g
Water:
4.5 g
Other:
2 g
Contains
more
Fats Fats
+57.8%
Contains
more
Water Water
+653.8%
Contains
more
Protein Protein
+59%
Contains
more
Carbs Carbs
+89.1%
Contains
more
Other Other
+85.2%
Fat Type Comparison
Fat type breakdown side-by-side comparison
1
59%
35%
5%
Saturated fat:
Sat. Fat
12.449 g
Monounsaturated fat:
Mono. Fat
7.336 g
Polyunsaturated fat:
Poly. Fat
1.149 g
2
32%
37%
31%
Saturated fat:
Sat. Fat
4.241 g
Monounsaturated fat:
Mono. Fat
4.865 g
Polyunsaturated fat:
Poly. Fat
4.153 g
Contains
more
Mono. Fat Monounsaturated fat
+50.8%
Contains
less
Sat. Fat Saturated fat
-65.9%
Contains
more
Poly. Fat Polyunsaturated fat
+261.4%