Significant differences between crab and squid The amount of iron, vitamin B2, vitamin B12, selenium, phosphorus, copper, vitamin A, potassium, and calcium in squid is higher than in crab. Squid covers your daily iron needs 129% more than crab. Crab contains less cholesterol. Specific food types used in this comparison are Crustaceans, crab, blue, canned and Mollusks, cuttlefish, mixed species, cooked, moist heat .
Infographic
Mineral Comparison
Mineral comparison score is based on the number of minerals by which one or the other food is richer. The "coverage" charts below show how much of the daily needs can be covered by 300 grams of the food.
1
100 g
300 g
1 oz - 28.35g 3 oz - 85g 1 can (6.5 oz), drained - 125g 1 cup - 135g
Magnesium
Magnesium
Calcium
Calcium
Potassium
Potassium
Iron
Iron
Copper
Copper
Zinc
Zinc
Phosphorus
Phosphorus
Sodium
Sodium
Manganese
Manganese
Selenium
Selenium
26%
27%
23%
19%
271%
104%
100%
73%
9.7%
234%
8
100 g
300 g
3 oz - 85g
Magnesium
Magnesium
Calcium
Calcium
Potassium
Potassium
Iron
Iron
Copper
Copper
Zinc
Zinc
Phosphorus
Phosphorus
Sodium
Sodium
Manganese
Manganese
Selenium
Selenium
43%
54%
56%
407%
333%
94%
249%
97%
27%
489%
Vitamin Comparison
Vitamin comparison score is based on the number of vitamins by which one or the other food is richer. The "coverage" charts below show how much of the daily needs can be covered by 300 grams of the food.
5
100 g
300 g
1 oz - 28.35g 3 oz - 85g 1 can (6.5 oz), drained - 125g 1 cup - 135g
Vitamin C
Vit. C
Vitamin D
Vit. D
Vitamin A
Vit. A
Vitamin E
Vit. E
Vitamin B1
Vit. B1
Vitamin B2
Vit. B2
Vitamin B3
Vit. B3
Vitamin B5
Vit. B5
Vitamin B6
Vit. B6
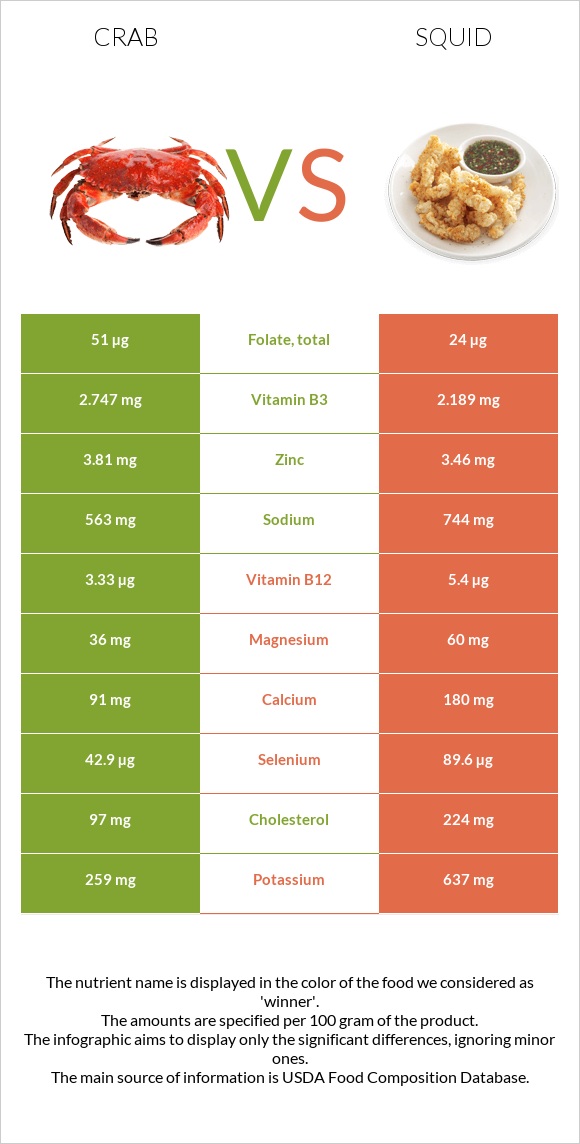
Vitamin B12
Vit. B12
Vitamin K
Vit. K
Folate
Folate
11%
0%
0.33%
37%
5.8%
21%
52%
60%
36%
416%
0.75%
38%
5
100 g
300 g
3 oz - 85g
Vitamin C
Vit. C
Vitamin D
Vit. D
Vitamin A
Vit. A
Vitamin E
Vit. E
Vitamin B1
Vit. B1
Vitamin B2
Vit. B2
Vitamin B3
Vit. B3
Vitamin B5
Vit. B5
Vitamin B6
Vit. B6
Vitamin B12
Vit. B12
Vitamin K
Vit. K
Folate
Folate
28%
0%
68%
0%
4.3%
399%
41%
54%
62%
675%
0%
18%
All nutrients comparison - raw data values
Nutrient
DV% diff.
Iron
0.5mg
10.84mg
129%
Vitamin B2
0.093mg
1.729mg
126%
Vitamin B12
3.33µg
5.4µg
86%
Selenium
42.9µg
89.6µg
85%
Phosphorus
234mg
580mg
49%
Cholesterol
97mg
224mg
42%
Protein
17.88g
32.48g
29%
Vitamin A
1µg
203µg
22%
Copper
0.814mg
0.998mg
20%
Choline
80.9mg
15%
Vitamin E
1.84mg
12%
Potassium
259mg
637mg
11%
Calcium
91mg
180mg
9%
Vitamin B6
0.156mg
0.27mg
9%
Sodium
563mg
744mg
8%
Folate
51µg
24µg
7%
Vitamin C
3.3mg
8.5mg
6%
Magnesium
36mg
60mg
6%
Manganese
0.074mg
0.209mg
6%
Calories
83kcal
158kcal
4%
Zinc
3.81mg
3.46mg
3%
Vitamin B3
2.747mg
2.189mg
3%
Vitamin B5
0.997mg
0.9mg
2%
Fats
0.74g
1.4g
1%
Carbs
0g
1.64g
1%
Vitamin B1
0.023mg
0.017mg
1%
Protein per 100 calories
22g
21g
N/A
Calories per 10 g protein
46kcal
49kcal
N/A
Weight per 100 calories
120g
63g
N/A
Net carbs
0g
1.64g
N/A
Vitamin K
0.3µg
0%
Trans fat
0.014g
N/A
Saturated fat
0.201g
0.236g
0%
Monounsaturated fat
0.129g
0.162g
0%
Polyunsaturated fat
0.258g
0.268g
0%
Tryptophan
0.226mg
0.364mg
0%
Threonine
0.727mg
1.398mg
0%
Isoleucine
0.776mg
1.414mg
0%
Leucine
1.307mg
2.287mg
0%
Lysine
1.386mg
2.427mg
0%
Methionine
0.452mg
0.733mg
0%
Phenylalanine
0.708mg
1.164mg
0%
Valine
0.806mg
1.419mg
0%
Histidine
0.393mg
0.624mg
0%
Omega-3 - EPA
0.101g
0.078g
N/A
Omega-3 - DHA
0.067g
0.132g
N/A
Omega-3 - DPA
0.009g
0.012g
N/A
Omega-6 - Eicosadienoic acid
0.005g
N/A
Macronutrient Comparison
Macronutrient breakdown side-by-side comparison
1
18%
80%
2%
Protein:
17.88 g
Fats:
0.74 g
Carbs:
0 g
Water:
79.69 g
Other:
1.69 g
4
32%
61%
3%
Protein:
32.48 g
Fats:
1.4 g
Carbs:
1.64 g
Water:
61.12 g
Other:
3.36 g
Contains
more
Water Water
+30.4%
Contains
more
Protein Protein
+81.7%
Contains
more
Fats Fats
+89.2%
Contains
more
Carbs Carbs
+∞%
Contains
more
Other Other
+98.8%
Fat Type Comparison
Fat type breakdown side-by-side comparison
1
34%
22%
44%
Saturated fat:
Sat. Fat
0.201 g
Monounsaturated fat:
Mono. Fat
0.129 g
Polyunsaturated fat:
Poly. Fat
0.258 g
2
35%
24%
40%
Saturated fat:
Sat. Fat
0.236 g
Monounsaturated fat:
Mono. Fat
0.162 g
Polyunsaturated fat:
Poly. Fat
0.268 g
Contains
less
Sat. Fat Saturated fat
-14.8%
Contains
more
Mono. Fat Monounsaturated fat
+25.6%
~equal in
Polyunsaturated fat
~0.268g