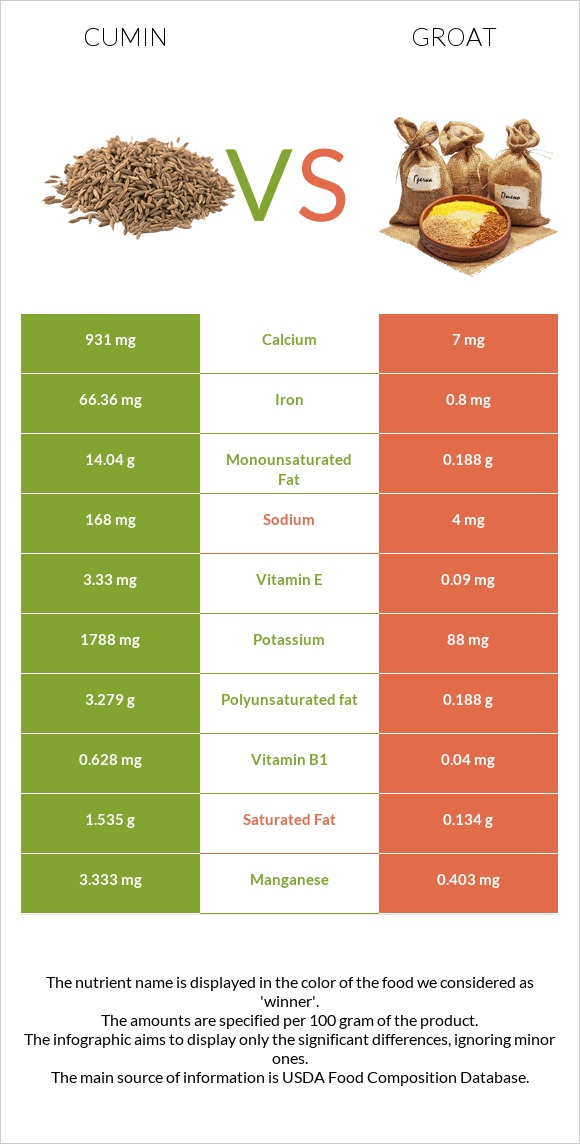
Important differences between cumin and groat Cumin has more iron, calcium, manganese, vitamin B1, potassium, magnesium, vitamin A, zinc, and phosphorus; however, groat has more copper. Cumin's daily need coverage for iron is 802% more. Groat has a higher glycemic index than cumin. The food varieties used in the comparison are Spices, cumin seed and Buckwheat .
Infographic
Mineral Comparison
Mineral comparison score is based on the number of minerals by which one or the other food is richer. The "coverage" charts below show how much of the daily needs can be covered by 300 grams of the food.
7
100 g
300 g
0.25 tsp, whole - 0.5g 1 tbsp, whole - 6g
Magnesium
Magnesium
Calcium
Calcium
Potassium
Potassium
Iron
Iron
Copper
Copper
Zinc
Zinc
Phosphorus
Phosphorus
Sodium
Sodium
Manganese
Manganese
Selenium
Selenium
261%
279%
158%
2489%
289%
131%
214%
22%
435%
28%
3
100 g
300 g
1 cup - 170g
Magnesium
Magnesium
Calcium
Calcium
Potassium
Potassium
Iron
Iron
Copper
Copper
Zinc
Zinc
Phosphorus
Phosphorus
Sodium
Sodium
Manganese
Manganese
Selenium
Selenium
165%
5.4%
41%
83%
367%
65%
149%
0.13%
170%
45%
Vitamin Comparison
Vitamin comparison score is based on the number of vitamins by which one or the other food is richer. The "coverage" charts below show how much of the daily needs can be covered by 300 grams of the food.
6
100 g
300 g
0.25 tsp, whole - 0.5g 1 tbsp, whole - 6g
Vitamin C
Vit. C
Vitamin D
Vit. D
Vitamin A
Vit. A
Vitamin E
Vit. E
Vitamin B1
Vit. B1
Vitamin B2
Vit. B2
Vitamin B3
Vit. B3
Vitamin B5
Vit. B5
Vitamin B6
Vit. B6
Vitamin B12
Vit. B12
Vitamin K
Vit. K
Folate
Folate
26%
0%
21%
67%
157%
75%
86%
0%
100%
0%
14%
7.5%
4
100 g
300 g
1 cup - 170g
Vitamin C
Vit. C
Vitamin D
Vit. D
Vitamin A
Vit. A
Vitamin E
Vit. E
Vitamin B1
Vit. B1
Vitamin B2
Vit. B2
Vitamin B3
Vit. B3
Vitamin B5
Vit. B5
Vitamin B6
Vit. B6
Vitamin B12
Vit. B12
Vitamin K
Vit. K
Folate
Folate
0%
0%
0%
0%
25%
98%
132%
74%
48%
0%
0%
23%
All nutrients comparison - raw data values
Nutrient
DV% diff.
Iron
66.36mg
2.2mg
802%
Calcium
931mg
18mg
91%
Manganese
3.333mg
1.3mg
88%
Vitamin B1
0.628mg
0.101mg
44%
Potassium
1788mg
460mg
39%
Monounsaturated fat
14.04g
1.04g
33%
Magnesium
366mg
231mg
32%
Fats
22.27g
3.4g
29%
Copper
0.867mg
1.1mg
26%
Vitamin B5
1.233mg
25%
Zinc
4.8mg
2.4mg
22%
Phosphorus
499mg
347mg
22%
Vitamin E
3.33mg
22%
Vitamin B6
0.435mg
0.21mg
17%
Vitamin B3
4.579mg
7.02mg
15%
Polyunsaturated fat
3.279g
1.039g
15%
Protein
17.81g
13.25g
9%
Vitamin C
7.7mg
0mg
9%
Carbs
44.24g
71.5g
9%
Vitamin B2
0.327mg
0.425mg
8%
Sodium
168mg
1mg
7%
Vitamin A
64µg
0µg
7%
Selenium
5.2µg
8.3µg
6%
Vitamin K
5.4µg
5%
Folate
10µg
30µg
5%
Choline
24.7mg
4%
Saturated fat
1.535g
0.741g
4%
Calories
375kcal
343kcal
2%
Fiber
10.5g
10g
2%
Protein per 100 calories
4.7g
3.9g
N/A
Calories per 10 g protein
211kcal
259kcal
N/A
Weight per 100 calories
27g
29g
N/A
Unsaturated / Saturated Fat ratio
11
2.8
N/A
Net carbs
33.74g
61.5g
N/A
Sugar
2.25g
N/A
Tryptophan
0.192mg
0%
Threonine
0.506mg
0%
Isoleucine
0.498mg
0%
Leucine
0.832mg
0%
Lysine
0.672mg
0%
Methionine
0.172mg
0%
Phenylalanine
0.52mg
0%
Valine
0.678mg
0%
Histidine
0.309mg
0%
Macronutrient Comparison
Macronutrient breakdown side-by-side comparison
3
18%
22%
44%
8%
8%
Protein:
17.81 g
Fats:
22.27 g
Carbs:
44.24 g
Water:
8.06 g
Other:
7.62 g
2
13%
3%
72%
10%
2%
Protein:
13.25 g
Fats:
3.4 g
Carbs:
71.5 g
Water:
9.75 g
Other:
2.1 g
Contains
more
Protein Protein
+34.4%
Contains
more
Fats Fats
+555%
Contains
more
Other Other
+262.9%
Contains
more
Carbs Carbs
+61.6%
Contains
more
Water Water
+21%
Fat Type Comparison
Fat type breakdown side-by-side comparison
2
8%
74%
17%
Saturated fat:
Sat. Fat
1.535 g
Monounsaturated fat:
Mono. Fat
14.04 g
Polyunsaturated fat:
Poly. Fat
3.279 g
1
26%
37%
37%
Saturated fat:
Sat. Fat
0.741 g
Monounsaturated fat:
Mono. Fat
1.04 g
Polyunsaturated fat:
Poly. Fat
1.039 g
Contains
more
Mono. Fat Monounsaturated fat
+1250%
Contains
more
Poly. Fat Polyunsaturated fat
+215.6%
Contains
less
Sat. Fat Saturated fat
-51.7%