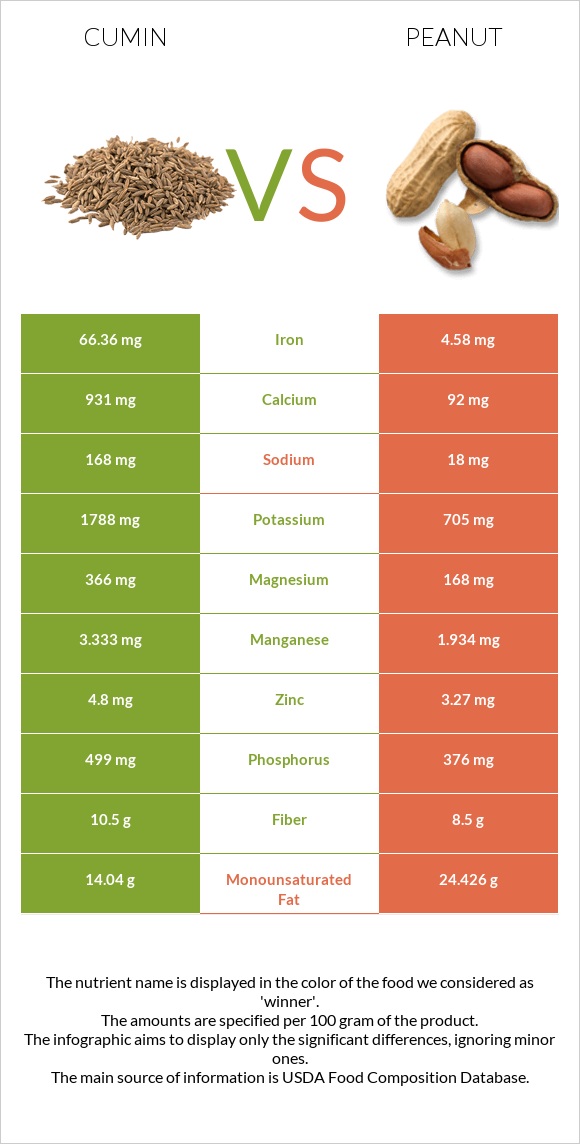
Differences between cumin and peanuts Cumin has more iron, calcium, manganese, magnesium, potassium, and vitamin A, while peanuts have more folate, vitamin B3, vitamin E, and copper. Cumin's daily need coverage for iron is 772% higher. Cumin has a lower glycemic index. The glycemic index of cumin is 0, while the glycemic index of peanuts is 13. The food types used in this comparison are Spices, cumin seed and Peanuts, all types, raw .
Infographic
Mineral Comparison
Mineral comparison score is based on the number of minerals by which one or the other food is richer. The "coverage" charts below show how much of the daily needs can be covered by 300 grams of the food.
7
100 g
300 g
0.25 tsp, whole - 0.5g 1 tbsp, whole - 6g
Magnesium
Magnesium
Calcium
Calcium
Potassium
Potassium
Iron
Iron
Copper
Copper
Zinc
Zinc
Phosphorus
Phosphorus
Sodium
Sodium
Manganese
Manganese
Selenium
Selenium
261%
279%
158%
2489%
289%
131%
214%
22%
435%
28%
3
100 g
300 g
1 oz - 28.35g 1 cup - 146g
Magnesium
Magnesium
Calcium
Calcium
Potassium
Potassium
Iron
Iron
Copper
Copper
Zinc
Zinc
Phosphorus
Phosphorus
Sodium
Sodium
Manganese
Manganese
Selenium
Selenium
120%
28%
62%
172%
381%
89%
161%
2.3%
252%
39%
Vitamin Comparison
Vitamin comparison score is based on the number of vitamins by which one or the other food is richer. The "coverage" charts below show how much of the daily needs can be covered by 300 grams of the food.
5
100 g
300 g
0.25 tsp, whole - 0.5g 1 tbsp, whole - 6g
Vitamin C
Vit. C
Vitamin D
Vit. D
Vitamin A
Vit. A
Vitamin E
Vit. E
Vitamin B1
Vit. B1
Vitamin B2
Vit. B2
Vitamin B3
Vit. B3
Vitamin B5
Vit. B5
Vitamin B6
Vit. B6
Vitamin B12
Vit. B12
Vitamin K
Vit. K
Folate
Folate
26%
0%
21%
67%
157%
75%
86%
0%
100%
0%
14%
7.5%
4
100 g
300 g
1 oz - 28.35g 1 cup - 146g
Vitamin C
Vit. C
Vitamin D
Vit. D
Vitamin A
Vit. A
Vitamin E
Vit. E
Vitamin B1
Vit. B1
Vitamin B2
Vit. B2
Vitamin B3
Vit. B3
Vitamin B5
Vit. B5
Vitamin B6
Vit. B6
Vitamin B12
Vit. B12
Vitamin K
Vit. K
Folate
Folate
0%
0%
0%
167%
160%
31%
226%
106%
80%
0%
0%
180%
All nutrients comparison - raw data values
Nutrient
DV% diff.
Iron
66.36mg
4.58mg
772%
Calcium
931mg
92mg
84%
Polyunsaturated fat
3.279g
15.558g
82%
Manganese
3.333mg
1.934mg
61%
Folate
10µg
240µg
58%
Magnesium
366mg
168mg
47%
Vitamin B3
4.579mg
12.066mg
47%
Fats
22.27g
49.24g
41%
Vitamin B5
1.767mg
35%
Vitamin E
3.33mg
8.33mg
33%
Potassium
1788mg
705mg
32%
Copper
0.867mg
1.144mg
31%
Monounsaturated fat
14.04g
24.426g
26%
Saturated fat
1.535g
6.279g
22%
Phosphorus
499mg
376mg
18%
Protein
17.81g
25.8g
16%
Vitamin B2
0.327mg
0.135mg
15%
Zinc
4.8mg
3.27mg
14%
Calories
375kcal
567kcal
10%
Vitamin C
7.7mg
0mg
9%
Carbs
44.24g
16.13g
9%
Fiber
10.5g
8.5g
8%
Sodium
168mg
18mg
7%
Vitamin A
64µg
0µg
7%
Vitamin B6
0.435mg
0.348mg
7%
Vitamin K
5.4µg
0µg
5%
Choline
24.7mg
52.5mg
5%
Selenium
5.2µg
7.2µg
4%
Vitamin B1
0.628mg
0.64mg
1%
Protein per 100 calories
4.7g
4.6g
N/A
Calories per 10 g protein
211kcal
220kcal
N/A
Weight per 100 calories
27g
18g
N/A
Unsaturated / Saturated Fat ratio
11
6.4
N/A
Net carbs
33.74g
7.63g
N/A
Sugar
2.25g
4.72g
N/A
Tryptophan
0.25mg
0%
Threonine
0.883mg
0%
Isoleucine
0.907mg
0%
Leucine
1.672mg
0%
Lysine
0.926mg
0%
Methionine
0.317mg
0%
Phenylalanine
1.377mg
0%
Valine
1.082mg
0%
Histidine
0.652mg
0%
Macronutrient Comparison
Macronutrient breakdown side-by-side comparison
3
18%
22%
44%
8%
8%
Protein:
17.81 g
Fats:
22.27 g
Carbs:
44.24 g
Water:
8.06 g
Other:
7.62 g
2
26%
49%
16%
7%
2%
Protein:
25.8 g
Fats:
49.24 g
Carbs:
16.13 g
Water:
6.5 g
Other:
2.33 g
Contains
more
Carbs Carbs
+174.3%
Contains
more
Water Water
+24%
Contains
more
Other Other
+227%
Contains
more
Protein Protein
+44.9%
Contains
more
Fats Fats
+121.1%
Fat Type Comparison
Fat type breakdown side-by-side comparison
1
8%
74%
17%
Saturated fat:
Sat. Fat
1.535 g
Monounsaturated fat:
Mono. Fat
14.04 g
Polyunsaturated fat:
Poly. Fat
3.279 g
2
14%
53%
34%
Saturated fat:
Sat. Fat
6.279 g
Monounsaturated fat:
Mono. Fat
24.426 g
Polyunsaturated fat:
Poly. Fat
15.558 g
Contains
less
Sat. Fat Saturated fat
-75.6%
Contains
more
Mono. Fat Monounsaturated fat
+74%
Contains
more
Poly. Fat Polyunsaturated fat
+374.5%