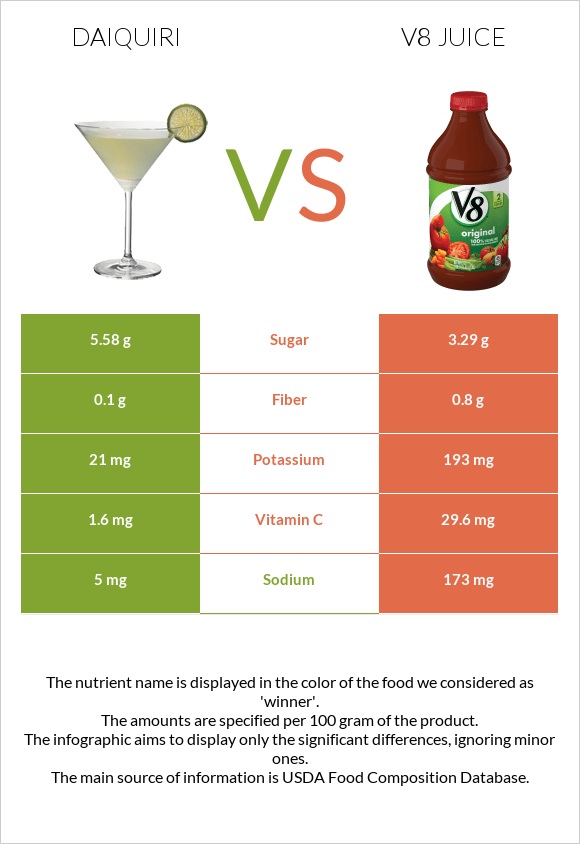
How are daiquiri and v8 juice different? V8 juice is higher than daiquiri in vitamin C, vitamin A, and potassium. V8 juice covers your daily need for vitamin C, 31% more than daiquiri. Daiquiri contains 2 times more sugar than v8 juice. Daiquiri contains 5.58g of sugar, while v8 juice contains 3.29g. V8 juice has a higher glycemic index (43) than daiquiri (15). Alcoholic beverage, daiquiri, prepared-from-recipe and CAMPBELL'S, V8 100% Vegetable Juice types were used in this article.
Infographic
Mineral Comparison
Mineral comparison score is based on the number of minerals by which one or the other food is richer. The "coverage" charts below show how much of the daily needs can be covered by 300 grams of the food.
7
100 g
300 g
1 fl oz - 30.2g 1 cocktail (2 fl oz) - 60g
Magnesium
Magnesium
Calcium
Calcium
Potassium
Potassium
Iron
Iron
Copper
Copper
Zinc
Zinc
Phosphorus
Phosphorus
Sodium
Sodium
Manganese
Manganese
Selenium
Selenium
1.4%
0.9%
1.9%
3.4%
7.3%
1.1%
2.1%
0.65%
2%
0.55%
3
100 g
300 g
8 fl oz - 243g 1 serving - 243g
Magnesium
Magnesium
Calcium
Calcium
Potassium
Potassium
Iron
Iron
Copper
Copper
Zinc
Zinc
Phosphorus
Phosphorus
Sodium
Sodium
Manganese
Manganese
Selenium
Selenium
0%
4.8%
17%
11%
0%
0%
0%
23%
0%
0%
Vitamin Comparison
Vitamin comparison score is based on the number of vitamins by which one or the other food is richer. The "coverage" charts below show how much of the daily needs can be covered by 300 grams of the food.
8
100 g
300 g
1 fl oz - 30.2g 1 cocktail (2 fl oz) - 60g
Vitamin C
Vit. C
Vitamin D
Vit. D
Vitamin A
Vit. A
Vitamin E
Vit. E
Vitamin B1
Vit. B1
Vitamin B2
Vit. B2
Vitamin B3
Vit. B3
Vitamin B5
Vit. B5
Vitamin B6
Vit. B6
Vitamin B12
Vit. B12
Vitamin K
Vit. K
Folate
Folate
5.3%
0%
0%
0.6%
3.3%
1.2%
0.96%
1%
1.8%
0%
0.25%
1.5%
1
100 g
300 g
8 fl oz - 243g 1 serving - 243g
Vitamin C
Vit. C
Vitamin D
Vit. D
Vitamin A
Vit. A
Vitamin E
Vit. E
Vitamin B1
Vit. B1
Vitamin B2
Vit. B2
Vitamin B3
Vit. B3
Vitamin B5
Vit. B5
Vitamin B6
Vit. B6
Vitamin B12
Vit. B12
Vitamin K
Vit. K
Folate
Folate
99%
0%
0%
0%
0%
0%
0%
0%
0%
0%
0%
0%
All nutrients comparison - raw data values
Nutrient
DV% diff.
Vitamin C
1.6mg
29.6mg
31%
Calories
186kcal
21kcal
8%
Sodium
5mg
173mg
7%
Potassium
21mg
193mg
5%
Iron
0.09mg
0.3mg
3%
Fiber
0.1g
0.8g
3%
Protein
0.06g
0.82g
2%
Copper
0.022mg
2%
Carbs
6.94g
4.12g
1%
Calcium
3mg
16mg
1%
Phosphorus
5mg
1%
Manganese
0.015mg
1%
Vitamin B1
0.013mg
1%
Vitamin B6
0.008mg
1%
Folate
2µg
1%
Protein per 100 calories
0.03g
3.9g
N/A
Calories per 10 g protein
31000kcal
256kcal
N/A
Weight per 100 calories
54g
476g
N/A
Fats
0.06g
0g
0%
Net carbs
6.84g
3.32g
N/A
Magnesium
2mg
0%
Sugar
5.58g
3.29g
N/A
Zinc
0.04mg
0%
Vitamin E
0.03mg
0mg
0%
Selenium
0.1µg
0%
Vitamin B2
0.005mg
0%
Vitamin B3
0.051mg
0%
Vitamin B5
0.017mg
0%
Vitamin K
0.1µg
0%
Saturated fat
0.006g
0g
0%
Monounsaturated fat
0.006g
0g
0%
Polyunsaturated fat
0.016g
0g
0%
Macronutrient Comparison
Macronutrient breakdown side-by-side comparison
3
7%
70%
23%
Protein:
0.06 g
Fats:
0.06 g
Carbs:
6.94 g
Water:
69.74 g
Other:
23.2 g
2
4%
94%
Protein:
0.82 g
Fats:
0 g
Carbs:
4.12 g
Water:
93.9 g
Other:
1.16 g
Contains
more
Fats Fats
+∞%
Contains
more
Carbs Carbs
+68.4%
Contains
more
Other Other
+1900%
Contains
more
Protein Protein
+1266.7%
Contains
more
Water Water
+34.6%