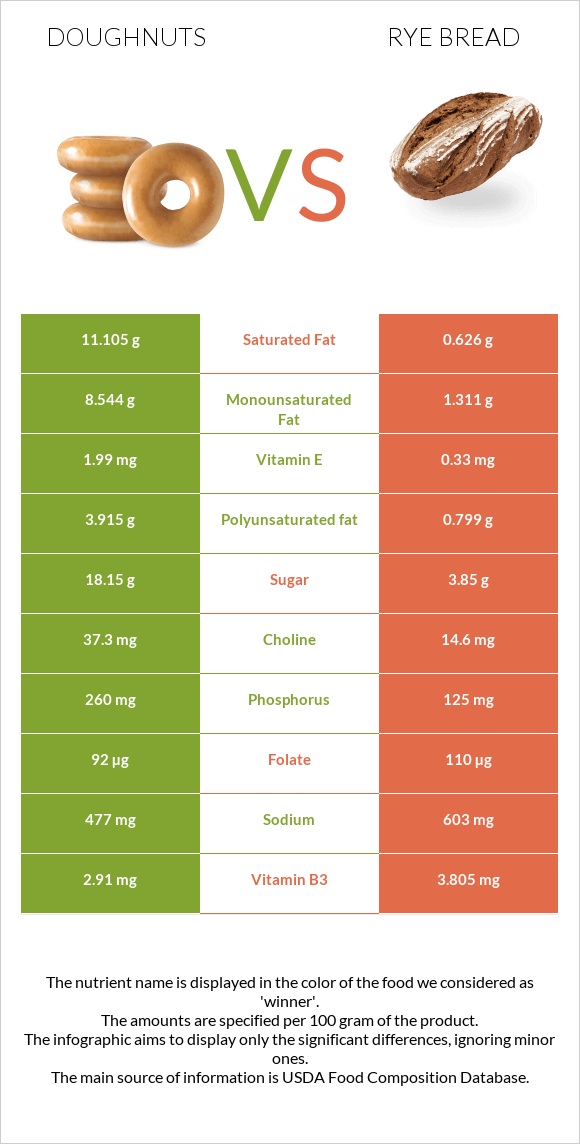
How are doughnuts and rye bread different? Doughnuts are richer in phosphorus, vitamin E, and vitamin K, while rye bread is higher in selenium, manganese, fiber, copper, zinc, and vitamin B3. Doughnuts cover your daily need for saturated fat, 52% more than rye bread. Doughnuts contain 8 times more vitamin K than rye bread. Doughnuts contain 9.8µg of vitamin K, while rye bread contains 1.2µg. Rye bread is lower in saturated fat. Doughnuts have a higher glycemic index (75) than rye bread (60). Doughnuts, cake-type, plain (includes unsugared, old-fashioned) and Bread, rye types were used in this article.
Infographic
Mineral Comparison
Mineral comparison score is based on the number of minerals by which one or the other food is richer. The "coverage" charts below show how much of the daily needs can be covered by 300 grams of the food.
2
100 g
300 g
1 doughnut, mini (1-1/2" dia) or doughnut hole - 14g 1 oz - 28.35g 1 donut - 40g 1 doughnut stick - 52g 1 doughnut, long type (twist) (4-1/2" long) - 52g 1 doughnut medium (3-1/4" dia) - 54g 1 doughnut, large (4" dia) - 71g
Magnesium
Magnesium
Calcium
Calcium
Potassium
Potassium
Iron
Iron
Copper
Copper
Zinc
Zinc
Phosphorus
Phosphorus
Sodium
Sodium
Manganese
Manganese
Selenium
Selenium
12%
12%
12%
95%
30%
14%
111%
62%
43%
55%
8
100 g
300 g
1 slice, snack-size - 7g 1 slice, thin - 25g 1 oz - 28.35g 1 slice, regular - 32g
Magnesium
Magnesium
Calcium
Calcium
Potassium
Potassium
Iron
Iron
Copper
Copper
Zinc
Zinc
Phosphorus
Phosphorus
Sodium
Sodium
Manganese
Manganese
Selenium
Selenium
29%
22%
15%
106%
62%
31%
54%
79%
107%
169%
Vitamin Comparison
Vitamin comparison score is based on the number of vitamins by which one or the other food is richer. The "coverage" charts below show how much of the daily needs can be covered by 300 grams of the food.
4
100 g
300 g
1 doughnut, mini (1-1/2" dia) or doughnut hole - 14g 1 oz - 28.35g 1 donut - 40g 1 doughnut stick - 52g 1 doughnut, long type (twist) (4-1/2" long) - 52g 1 doughnut medium (3-1/4" dia) - 54g 1 doughnut, large (4" dia) - 71g
Vitamin C
Vit. C
Vitamin D
Vit. D
Vitamin A
Vit. A
Vitamin E
Vit. E
Vitamin B1
Vit. B1
Vitamin B2
Vit. B2
Vitamin B3
Vit. B3
Vitamin B5
Vit. B5
Vitamin B6
Vit. B6
Vitamin B12
Vit. B12
Vitamin K
Vit. K
Folate
Folate
0%
0%
1.3%
40%
98%
69%
55%
23%
12%
7.5%
25%
69%
7
100 g
300 g
1 slice, snack-size - 7g 1 slice, thin - 25g 1 oz - 28.35g 1 slice, regular - 32g
Vitamin C
Vit. C
Vitamin D
Vit. D
Vitamin A
Vit. A
Vitamin E
Vit. E
Vitamin B1
Vit. B1
Vitamin B2
Vit. B2
Vitamin B3
Vit. B3
Vitamin B5
Vit. B5
Vitamin B6
Vit. B6
Vitamin B12
Vit. B12
Vitamin K
Vit. K
Folate
Folate
1.3%
0%
0%
6.6%
109%
77%
71%
26%
17%
0%
3%
83%
All nutrients comparison - raw data values
Nutrient
DV% diff.
Saturated fat
11.105g
0.626g
48%
Selenium
10.1µg
30.9µg
38%
Fats
24.93g
3.3g
33%
Manganese
0.333mg
0.824mg
21%
Polyunsaturated fat
3.915g
0.799g
21%
Phosphorus
260mg
125mg
19%
Monounsaturated fat
8.544g
1.311g
18%
Fiber
1.7g
5.8g
16%
Copper
0.09mg
0.186mg
11%
Starch
25.91g
11%
Vitamin E
1.99mg
0.33mg
11%
Calories
434kcal
259kcal
9%
Vitamin K
9.8µg
1.2µg
7%
Protein
5.31g
8.5g
6%
Zinc
0.5mg
1.14mg
6%
Vitamin B3
2.91mg
3.805mg
6%
Magnesium
17mg
40mg
5%
Sodium
477mg
603mg
5%
Folate
92µg
110µg
5%
Iron
2.53mg
2.83mg
4%
Vitamin B1
0.39mg
0.434mg
4%
Choline
37.3mg
14.6mg
4%
Cholesterol
10mg
0mg
3%
Calcium
40mg
73mg
3%
Vitamin B2
0.301mg
0.335mg
3%
Vitamin B12
0.06µg
0µg
3%
Vitamin B6
0.05mg
0.075mg
2%
Potassium
134mg
166mg
1%
Vitamin B5
0.377mg
0.44mg
1%
Protein per 100 calories
1.2g
3.3g
N/A
Calories per 10 g protein
817kcal
305kcal
N/A
Weight per 100 calories
23g
39g
N/A
Unsaturated / Saturated Fat ratio
1.1
3.4
N/A
Vitamin C
0mg
0.4mg
0%
Net carbs
45.36g
42.5g
N/A
Carbs
47.06g
48.3g
0%
Sugar
18.15g
3.85g
N/A
Vitamin A
4µg
0µg
0%
Tryptophan
0.096mg
0%
Threonine
0.255mg
0%
Isoleucine
0.319mg
0%
Leucine
0.579mg
0%
Lysine
0.233mg
0%
Methionine
0.139mg
0%
Phenylalanine
0.411mg
0%
Valine
0.379mg
0%
Histidine
0.182mg
0%
Omega-3 - DHA
0.001g
0g
N/A
Omega-3 - ALA
0.239g
N/A
Omega-3 - Eicosatrienoic acid
0.001g
N/A
Omega-6 - Gamma-linoleic acid
0.017g
N/A
Omega-6 - Eicosadienoic acid
0.006g
N/A
Omega-6 - Linoleic acid
3.573g
N/A
Macronutrient Comparison
Macronutrient breakdown side-by-side comparison
1
5%
25%
47%
21%
2%
Protein:
5.31 g
Fats:
24.93 g
Carbs:
47.06 g
Water:
20.82 g
Other:
1.88 g
4
9%
3%
48%
37%
3%
Protein:
8.5 g
Fats:
3.3 g
Carbs:
48.3 g
Water:
37.3 g
Other:
2.6 g
Contains
more
Fats Fats
+655.5%
Contains
more
Protein Protein
+60.1%
Contains
more
Water Water
+79.2%
Contains
more
Other Other
+38.3%
Fat Type Comparison
Fat type breakdown side-by-side comparison
2
47%
36%
17%
Saturated fat:
Sat. Fat
11.105 g
Monounsaturated fat:
Mono. Fat
8.544 g
Polyunsaturated fat:
Poly. Fat
3.915 g
1
23%
48%
29%
Saturated fat:
Sat. Fat
0.626 g
Monounsaturated fat:
Mono. Fat
1.311 g
Polyunsaturated fat:
Poly. Fat
0.799 g
Contains
more
Mono. Fat Monounsaturated fat
+551.7%
Contains
more
Poly. Fat Polyunsaturated fat
+390%
Contains
less
Sat. Fat Saturated fat
-94.4%