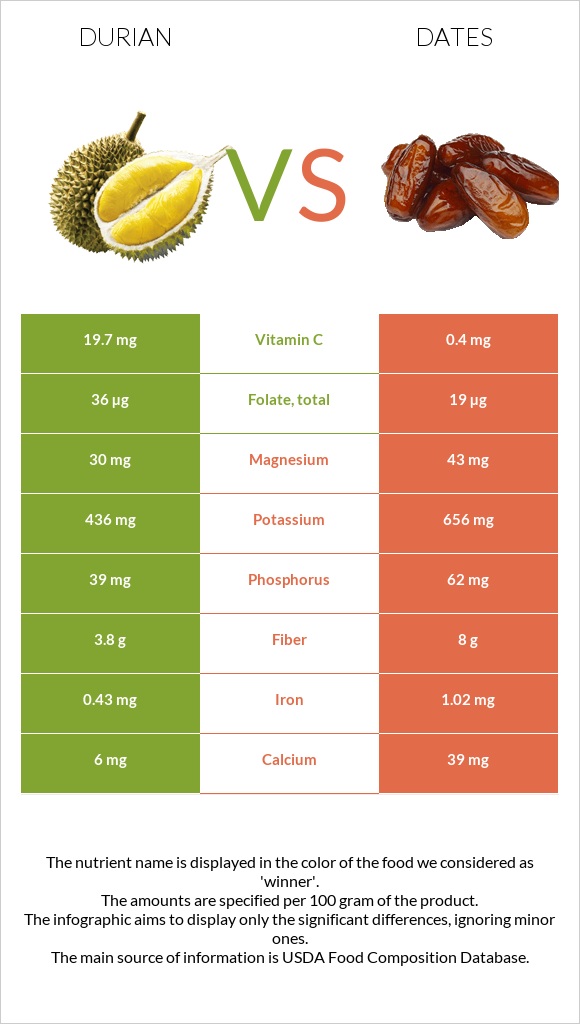
How are durian and dates different? Durian is higher in vitamin B1, vitamin C, vitamin B6, and vitamin B2; however, dates are richer in fiber, iron, vitamin B5, and potassium. Daily need coverage for vitamin B1 for durian is 27% higher. Durian contains 49 times more vitamin C than dates. While durian contains 19.7mg of vitamin C, dates contain only 0.4mg. Durian, raw or frozen and Dates, deglet noor are the varieties used in this article.
Infographic
Mineral Comparison
Mineral comparison score is based on the number of minerals by which one or the other food is richer. The "coverage" charts below show how much of the daily needs can be covered by 300 grams of the food.
1
100 g
300 g
1 cup, chopped or diced - 243g 1 fruit - 602g
Magnesium
Magnesium
Calcium
Calcium
Potassium
Potassium
Iron
Iron
Copper
Copper
Zinc
Zinc
Phosphorus
Phosphorus
Sodium
Sodium
Manganese
Manganese
Selenium
Selenium
21%
1.8%
38%
16%
69%
7.6%
17%
0.26%
42%
0%
6
100 g
300 g
1 date, pitted - 7.1g 1 cup, chopped - 147g
Magnesium
Magnesium
Calcium
Calcium
Potassium
Potassium
Iron
Iron
Copper
Copper
Zinc
Zinc
Phosphorus
Phosphorus
Sodium
Sodium
Manganese
Manganese
Selenium
Selenium
31%
12%
58%
38%
69%
7.9%
27%
0.26%
34%
16%
Vitamin Comparison
Vitamin comparison score is based on the number of vitamins by which one or the other food is richer. The "coverage" charts below show how much of the daily needs can be covered by 300 grams of the food.
6
100 g
300 g
1 cup, chopped or diced - 243g 1 fruit - 602g
Vitamin C
Vit. C
Vitamin D
Vit. D
Vitamin A
Vit. A
Vitamin E
Vit. E
Vitamin B1
Vit. B1
Vitamin B2
Vit. B2
Vitamin B3
Vit. B3
Vitamin B5
Vit. B5
Vitamin B6
Vit. B6
Vitamin B12
Vit. B12
Vitamin K
Vit. K
Folate
Folate
66%
0%
0.67%
0%
94%
46%
20%
14%
73%
0%
0%
27%
4
100 g
300 g
1 date, pitted - 7.1g 1 cup, chopped - 147g
Vitamin C
Vit. C
Vitamin D
Vit. D
Vitamin A
Vit. A
Vitamin E
Vit. E
Vitamin B1
Vit. B1
Vitamin B2
Vit. B2
Vitamin B3
Vit. B3
Vitamin B5
Vit. B5
Vitamin B6
Vit. B6
Vitamin B12
Vit. B12
Vitamin K
Vit. K
Folate
Folate
1.3%
0%
0%
1%
13%
15%
24%
35%
38%
0%
6.8%
14%
All nutrients comparison - raw data values
Nutrient
DV% diff.
Vitamin B1
0.374mg
0.052mg
27%
Fructose
19.56g
24%
Vitamin C
19.7mg
0.4mg
21%
Fiber
3.8g
8g
17%
Carbs
27.09g
75.03g
16%
Vitamin B6
0.316mg
0.165mg
12%
Vitamin B2
0.2mg
0.066mg
10%
Fats
5.33g
0.39g
8%
Calories
147kcal
282kcal
7%
Iron
0.43mg
1.02mg
7%
Vitamin B5
0.23mg
0.589mg
7%
Potassium
436mg
656mg
6%
Selenium
3µg
5%
Folate
36µg
19µg
4%
Magnesium
30mg
43mg
3%
Calcium
6mg
39mg
3%
Phosphorus
39mg
62mg
3%
Manganese
0.325mg
0.262mg
3%
Protein
1.47g
2.45g
2%
Vitamin K
2.7µg
2%
Vitamin B3
1.074mg
1.274mg
1%
Choline
6.3mg
1%
Weight per 100 calories
68g
35g
N/A
Unsaturated / Saturated Fat ratio
1.7
N/A
Net carbs
23.29g
67.03g
N/A
Sugar
63.35g
N/A
Copper
0.207mg
0.206mg
0%
Zinc
0.28mg
0.29mg
0%
Sodium
2mg
2mg
0%
Vitamin A
2µg
0µg
0%
Vitamin E
0.05mg
0%
Saturated fat
0.032g
0%
Monounsaturated fat
0.036g
0%
Polyunsaturated fat
0.019g
0%
Tryptophan
0.012mg
0%
Threonine
0.043mg
0%
Isoleucine
0.049mg
0%
Leucine
0.084mg
0%
Lysine
0.066mg
0%
Methionine
0.022mg
0%
Phenylalanine
0.05mg
0%
Valine
0.071mg
0%
Histidine
0.032mg
0%
Macronutrient Comparison
Macronutrient breakdown side-by-side comparison
2
5%
27%
65%
Protein:
1.47 g
Fats:
5.33 g
Carbs:
27.09 g
Water:
64.99 g
Other:
1.12 g
3
2%
75%
21%
Protein:
2.45 g
Fats:
0.39 g
Carbs:
75.03 g
Water:
20.53 g
Other:
1.6 g
Contains
more
Fats Fats
+1266.7%
Contains
more
Water Water
+216.6%
Contains
more
Protein Protein
+66.7%
Contains
more
Carbs Carbs
+177%
Contains
more
Other Other
+42.9%