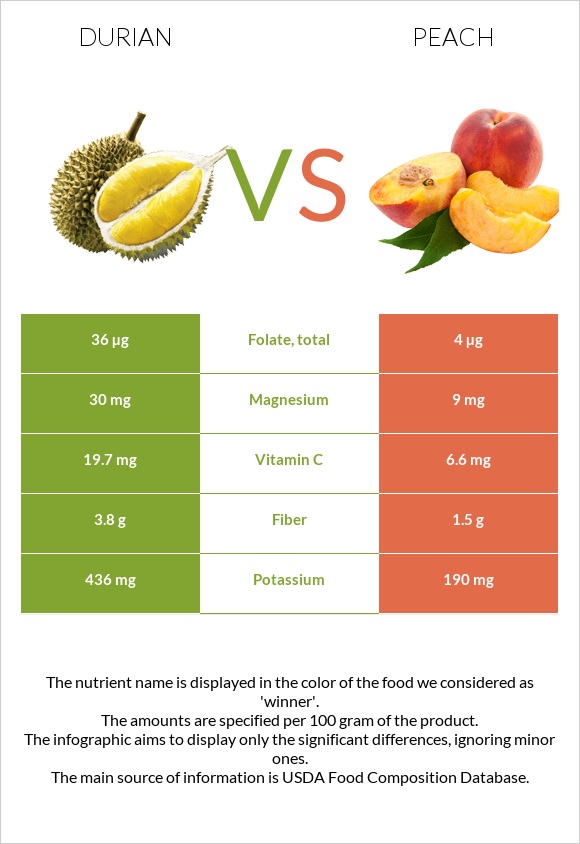
How are durian and peach different? Durian is richer in vitamin B1, vitamin B6, copper, vitamin C, vitamin B2, manganese, fiber, folate, and potassium, while peach is higher in vitamin A. Durian covers your daily need for vitamin B1, 29% more than peach. Durian contains 13 times more vitamin B6 than peach. Durian contains 0.316mg of vitamin B6, while peach contains 0.025mg. Durian, raw or frozen and Peaches, yellow, raw types were used in this article.
Infographic
Mineral Comparison
Mineral comparison score is based on the number of minerals by which one or the other food is richer. The "coverage" charts below show how much of the daily needs can be covered by 300 grams of the food.
7
100 g
300 g
1 cup, chopped or diced - 243g 1 fruit - 602g
Magnesium
Magnesium
Calcium
Calcium
Potassium
Potassium
Iron
Iron
Copper
Copper
Zinc
Zinc
Phosphorus
Phosphorus
Sodium
Sodium
Manganese
Manganese
Selenium
Selenium
21%
1.8%
38%
16%
69%
7.6%
17%
0.26%
42%
0%
2
100 g
300 g
1 small (2-1/2" dia) - 130g 1 NLEA serving - 147g 1 medium (2-2/3" dia) - 150g 1 cup slices - 154g 1 large (2-3/4" dia) - 175g 1 extra large (3" dia) - 224g
Magnesium
Magnesium
Calcium
Calcium
Potassium
Potassium
Iron
Iron
Copper
Copper
Zinc
Zinc
Phosphorus
Phosphorus
Sodium
Sodium
Manganese
Manganese
Selenium
Selenium
6.4%
1.8%
17%
9.4%
23%
4.6%
8.6%
0%
8%
0.55%
Vitamin Comparison
Vitamin comparison score is based on the number of vitamins by which one or the other food is richer. The "coverage" charts below show how much of the daily needs can be covered by 300 grams of the food.
7
100 g
300 g
1 cup, chopped or diced - 243g 1 fruit - 602g
Vitamin C
Vit. C
Vitamin D
Vit. D
Vitamin A
Vit. A
Vitamin E
Vit. E
Vitamin B1
Vit. B1
Vitamin B2
Vit. B2
Vitamin B3
Vit. B3
Vitamin B5
Vit. B5
Vitamin B6
Vit. B6
Vitamin B12
Vit. B12
Vitamin K
Vit. K
Folate
Folate
66%
0%
0.67%
0%
94%
46%
20%
14%
73%
0%
0%
27%
3
100 g
300 g
1 small (2-1/2" dia) - 130g 1 NLEA serving - 147g 1 medium (2-2/3" dia) - 150g 1 cup slices - 154g 1 large (2-3/4" dia) - 175g 1 extra large (3" dia) - 224g
Vitamin C
Vit. C
Vitamin D
Vit. D
Vitamin A
Vit. A
Vitamin E
Vit. E
Vitamin B1
Vit. B1
Vitamin B2
Vit. B2
Vitamin B3
Vit. B3
Vitamin B5
Vit. B5
Vitamin B6
Vit. B6
Vitamin B12
Vit. B12
Vitamin K
Vit. K
Folate
Folate
22%
0%
5.3%
15%
6%
7.2%
15%
9.2%
5.8%
0%
6.5%
3%
All nutrients comparison - raw data values
Nutrient
DV% diff.
Vitamin B1
0.374mg
0.024mg
29%
Vitamin B6
0.316mg
0.025mg
22%
Vitamin C
19.7mg
6.6mg
15%
Copper
0.207mg
0.068mg
15%
Vitamin B2
0.2mg
0.031mg
13%
Manganese
0.325mg
0.061mg
11%
Fiber
3.8g
1.5g
9%
Fats
5.33g
0.25g
8%
Folate
36µg
4µg
8%
Potassium
436mg
190mg
7%
Carbs
27.09g
9.54g
6%
Calories
147kcal
39kcal
5%
Magnesium
30mg
9mg
5%
Vitamin E
0.73mg
5%
Phosphorus
39mg
20mg
3%
Iron
0.43mg
0.25mg
2%
Vitamin A
2µg
16µg
2%
Vitamin B3
1.074mg
0.806mg
2%
Vitamin B5
0.23mg
0.153mg
2%
Vitamin K
2.6µg
2%
Fructose
1.53g
2%
Protein
1.47g
0.91g
1%
Zinc
0.28mg
0.17mg
1%
Choline
6.1mg
1%
Polyunsaturated fat
0.086g
1%
Protein per 100 calories
1g
2.3g
N/A
Calories per 10 g protein
1000kcal
429kcal
N/A
Weight per 100 calories
68g
256g
N/A
Unsaturated / Saturated Fat ratio
8.1
N/A
Net carbs
23.29g
8.04g
N/A
Calcium
6mg
6mg
0%
Sugar
8.39g
N/A
Sodium
2mg
0mg
0%
Selenium
0.1µg
0%
Saturated fat
0.019g
0%
Monounsaturated fat
0.067g
0%
Tryptophan
0.01mg
0%
Threonine
0.016mg
0%
Isoleucine
0.017mg
0%
Leucine
0.027mg
0%
Lysine
0.03mg
0%
Methionine
0.01mg
0%
Phenylalanine
0.019mg
0%
Valine
0.022mg
0%
Histidine
0.013mg
0%
Macronutrient Comparison
Macronutrient breakdown side-by-side comparison
4
5%
27%
65%
Protein:
1.47 g
Fats:
5.33 g
Carbs:
27.09 g
Water:
64.99 g
Other:
1.12 g
1
10%
89%
Protein:
0.91 g
Fats:
0.25 g
Carbs:
9.54 g
Water:
88.87 g
Other:
0.43 g
Contains
more
Protein Protein
+61.5%
Contains
more
Fats Fats
+2032%
Contains
more
Carbs Carbs
+184%
Contains
more
Other Other
+160.5%
Contains
more
Water Water
+36.7%