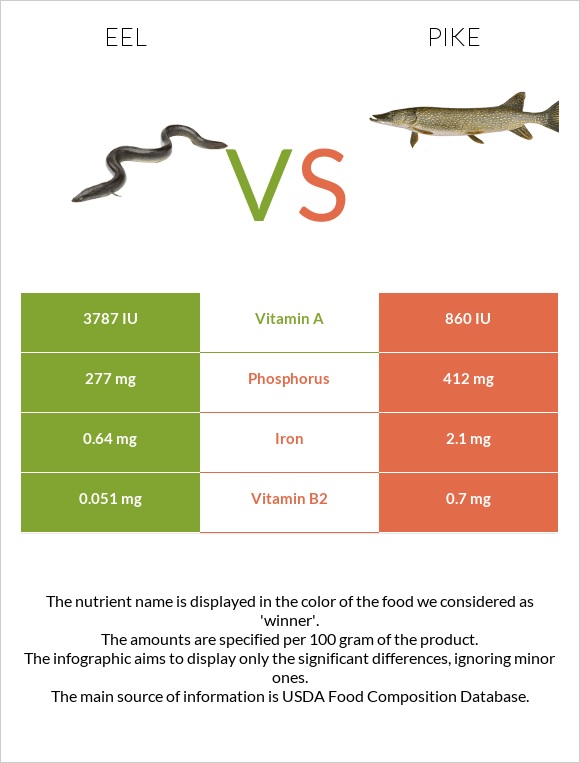
What are the main differences between eels and pike? Eels are richer in vitamin A and vitamin B1, yet pike is richer in vitamin B2, phosphorus, and iron. Eels' daily need coverage for vitamin A is 59% higher. Eels have 2 times more vitamin B1 than pike. Eels have 0.183mg of vitamin B1, while pike has 0.1mg. We used Fish, eel, mixed species, cooked, dry heat and Fish, pike, northern, liver (Alaska Native) types in this comparison.
Infographic
Mineral Comparison
Mineral comparison score is based on the number of minerals by which one or the other food is richer. The "coverage" charts below show how much of the daily needs can be covered by 300 grams of the food.
6
100 g
300 g
1 cubic inch, boneless - 17g 1 oz with bone (yield after bone removed) - 22g 1 oz, boneless - 28.35g 3 oz - 85g 1 fillet - 159g
Magnesium
Magnesium
Calcium
Calcium
Potassium
Potassium
Iron
Iron
Copper
Copper
Zinc
Zinc
Phosphorus
Phosphorus
Sodium
Sodium
Manganese
Manganese
Selenium
Selenium
19%
7.8%
31%
24%
9.7%
57%
119%
8.5%
5.2%
45%
3
100 g
300 g
Magnesium
Magnesium
Calcium
Calcium
Potassium
Potassium
Iron
Iron
Copper
Copper
Zinc
Zinc
Phosphorus
Phosphorus
Sodium
Sodium
Manganese
Manganese
Selenium
Selenium
0%
8.4%
0%
79%
0%
0%
177%
0%
0%
0%
Vitamin Comparison
Vitamin comparison score is based on the number of vitamins by which one or the other food is richer. The "coverage" charts below show how much of the daily needs can be covered by 300 grams of the food.
7
100 g
300 g
1 cubic inch, boneless - 17g 1 oz with bone (yield after bone removed) - 22g 1 oz, boneless - 28.35g 3 oz - 85g 1 fillet - 159g
Vitamin C
Vit. C
Vitamin D
Vit. D
Vitamin A
Vit. A
Vitamin E
Vit. E
Vitamin B1
Vit. B1
Vitamin B2
Vit. B2
Vitamin B3
Vit. B3
Vitamin B5
Vit. B5
Vitamin B6
Vit. B6
Vitamin B12
Vit. B12
Vitamin K
Vit. K
Folate
Folate
6%
0%
379%
0%
46%
12%
84%
17%
18%
361%
0%
13%
2
100 g
300 g
Vitamin C
Vit. C
Vitamin D
Vit. D
Vitamin A
Vit. A
Vitamin E
Vit. E
Vitamin B1
Vit. B1
Vitamin B2
Vit. B2
Vitamin B3
Vit. B3
Vitamin B5
Vit. B5
Vitamin B6
Vit. B6
Vitamin B12
Vit. B12
Vitamin K
Vit. K
Folate
Folate
0%
0%
0%
0%
25%
162%
94%
0%
0%
0%
0%
0%
All nutrients comparison - raw data values
Nutrient
DV% diff.
Vitamin A
1137µg
126%
Vitamin B12
2.89µg
120%
Cholesterol
161mg
54%
Vitamin B2
0.051mg
0.7mg
50%
Monounsaturated fat
9.218g
23%
Zinc
2.08mg
19%
Phosphorus
277mg
412mg
19%
Iron
0.64mg
2.1mg
18%
Selenium
8.3µg
15%
Protein
23.65g
16.6g
14%
Saturated fat
3.023g
14%
Fats
14.95g
8g
11%
Potassium
349mg
10%
Polyunsaturated fat
1.214g
8%
Vitamin B1
0.183mg
0.1mg
7%
Magnesium
26mg
6%
Vitamin B5
0.28mg
6%
Vitamin B6
0.077mg
6%
Calories
236kcal
156kcal
4%
Folate
17µg
4%
Copper
0.029mg
3%
Sodium
65mg
3%
Vitamin B3
4.487mg
5mg
3%
Vitamin C
1.8mg
2%
Manganese
0.04mg
2%
Carbs
0g
4.3g
1%
Protein per 100 calories
10g
11g
N/A
Calories per 10 g protein
100kcal
94kcal
N/A
Weight per 100 calories
42g
64g
N/A
Unsaturated / Saturated Fat ratio
3.5
N/A
Net carbs
0g
4.3g
N/A
Calcium
26mg
28mg
0%
Tryptophan
0.265mg
0%
Threonine
1.037mg
0%
Isoleucine
1.09mg
0%
Leucine
1.922mg
0%
Lysine
2.171mg
0%
Methionine
0.7mg
0%
Phenylalanine
0.923mg
0%
Valine
1.218mg
0%
Histidine
0.696mg
0%
Omega-3 - EPA
0.108g
N/A
Omega-3 - DHA
0.081g
N/A
Omega-3 - DPA
0.095g
N/A
Macronutrient Comparison
Macronutrient breakdown side-by-side comparison
3
24%
15%
59%
2%
Protein:
23.65 g
Fats:
14.95 g
Carbs:
0 g
Water:
59.31 g
Other:
2.09 g
2
17%
8%
4%
70%
Protein:
16.6 g
Fats:
8 g
Carbs:
4.3 g
Water:
69.8 g
Other:
1.3 g
Contains
more
Protein Protein
+42.5%
Contains
more
Fats Fats
+86.9%
Contains
more
Other Other
+60.8%
Contains
more
Carbs Carbs
+∞%
Contains
more
Water Water
+17.7%