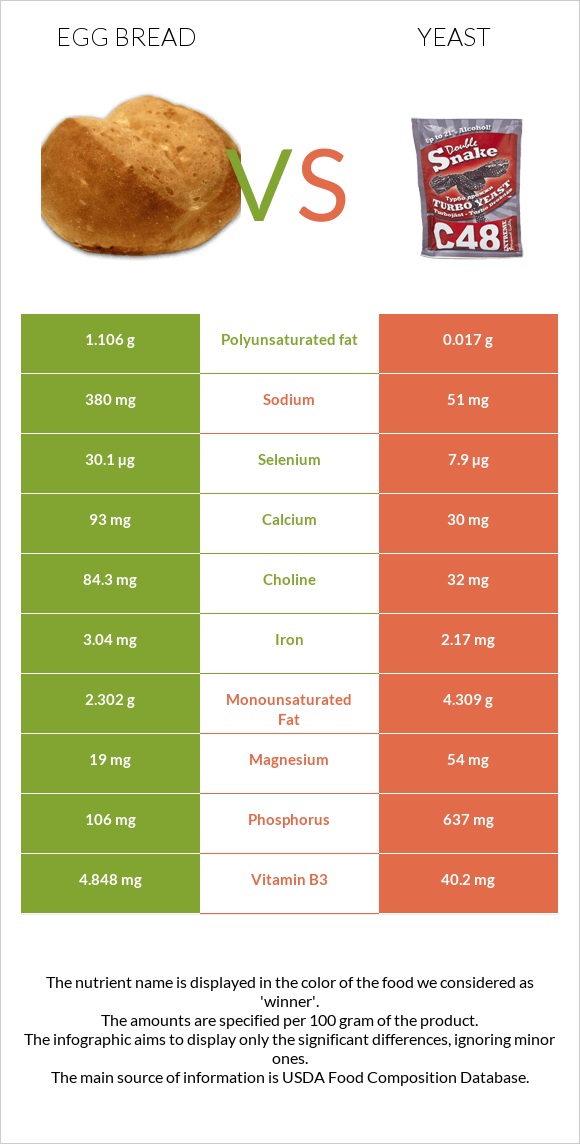
Important differences between egg bread and yeast Egg bread has more selenium; however, yeast has more vitamin B1, folate, vitamin B2, vitamin B5, vitamin B3, vitamin B6, fiber, phosphorus, and zinc. Yeast's daily need coverage for vitamin B1 is 879% more. Egg bread has 4 times more selenium than yeast. Egg bread has 30.1µg of selenium, while yeast has 7.9µg. The food varieties used in the comparison are Bread, egg and Leavening agents, yeast, baker's, active dry .
Infographic
Mineral Comparison
Mineral comparison score is based on the number of minerals by which one or the other food is richer. The "coverage" charts below show how much of the daily needs can be covered by 300 grams of the food.
4
100 g
300 g
1 oz - 28.35g 1 slice (5" x 3" x 1/2") - 40g
Magnesium
Magnesium
Calcium
Calcium
Potassium
Potassium
Iron
Iron
Copper
Copper
Zinc
Zinc
Phosphorus
Phosphorus
Sodium
Sodium
Manganese
Manganese
Selenium
Selenium
14%
28%
10%
114%
54%
22%
45%
50%
65%
164%
6
100 g
300 g
1 tsp - 4g 1 packet - 7.2g 1 tbsp - 12g
Magnesium
Magnesium
Calcium
Calcium
Potassium
Potassium
Iron
Iron
Copper
Copper
Zinc
Zinc
Phosphorus
Phosphorus
Sodium
Sodium
Manganese
Manganese
Selenium
Selenium
39%
9%
84%
81%
145%
217%
273%
6.7%
41%
43%
Vitamin Comparison
Vitamin comparison score is based on the number of vitamins by which one or the other food is richer. The "coverage" charts below show how much of the daily needs can be covered by 300 grams of the food.
5
100 g
300 g
1 oz - 28.35g 1 slice (5" x 3" x 1/2") - 40g
Vitamin C
Vit. C
Vitamin D
Vit. D
Vitamin A
Vit. A
Vitamin E
Vit. E
Vitamin B1
Vit. B1
Vitamin B2
Vit. B2
Vitamin B3
Vit. B3
Vitamin B5
Vit. B5
Vitamin B6
Vit. B6
Vitamin B12
Vit. B12
Vitamin K
Vit. K
Folate
Folate
0%
6%
21%
5.2%
110%
101%
91%
17%
15%
13%
2.3%
79%
7
100 g
300 g
1 tsp - 4g 1 packet - 7.2g 1 tbsp - 12g
Vitamin C
Vit. C
Vitamin D
Vit. D
Vitamin A
Vit. A
Vitamin E
Vit. E
Vitamin B1
Vit. B1
Vitamin B2
Vit. B2
Vitamin B3
Vit. B3
Vitamin B5
Vit. B5
Vitamin B6
Vit. B6
Vitamin B12
Vit. B12
Vitamin K
Vit. K
Folate
Folate
1%
0%
0%
0%
2748%
923%
754%
810%
346%
8.8%
1%
1755%
All nutrients comparison - raw data values
Nutrient
DV% diff.
Vitamin B1
0.438mg
10.99mg
879%
Folate
105µg
2340µg
559%
Vitamin B2
0.436mg
4mg
274%
Vitamin B5
0.282mg
13.5mg
264%
Vitamin B3
4.848mg
40.2mg
221%
Vitamin B6
0.064mg
1.5mg
110%
Fiber
2.3g
26.9g
98%
Phosphorus
106mg
637mg
76%
Zinc
0.79mg
7.94mg
65%
Protein
9.5g
40.44g
62%
Selenium
30.1µg
7.9µg
40%
Copper
0.162mg
0.436mg
30%
Potassium
115mg
955mg
25%
Cholesterol
51mg
0mg
17%
Sodium
380mg
51mg
14%
Iron
3.04mg
2.17mg
11%
Choline
84.3mg
32mg
10%
Magnesium
19mg
54mg
8%
Manganese
0.5mg
0.312mg
8%
Vitamin A
63µg
0µg
7%
Polyunsaturated fat
1.106g
0.017g
7%
Calcium
93mg
30mg
6%
Monounsaturated fat
2.302g
4.309g
5%
Saturated fat
1.593g
1.001g
3%
Calories
287kcal
325kcal
2%
Fats
6g
7.61g
2%
Carbs
47.8g
41.22g
2%
Vitamin D*
16 IU
0 IU
2%
Vitamin D
0.4µg
0µg
2%
Vitamin E
0.26mg
0mg
2%
Vitamin B12
0.1µg
0.07µg
1%
Protein per 100 calories
3.3g
12g
N/A
Calories per 10 g protein
302kcal
80kcal
N/A
Weight per 100 calories
35g
31g
N/A
Unsaturated / Saturated Fat ratio
2.1
4.3
N/A
Vitamin C
0mg
0.3mg
0%
Net carbs
45.5g
14.32g
N/A
Sugar
1.78g
0g
N/A
Vitamin K
0.9µg
0.4µg
0%
Tryptophan
0.112mg
0.54mg
0%
Threonine
0.306mg
1.99mg
0%
Isoleucine
0.394mg
1.89mg
0%
Leucine
0.692mg
2.92mg
0%
Lysine
0.311mg
3.28mg
0%
Methionine
0.189mg
0.59mg
0%
Phenylalanine
0.475mg
1.75mg
0%
Valine
0.443mg
2.31mg
0%
Histidine
0.21mg
0.91mg
0%
Omega-3 - EPA
0.001g
0g
N/A
Omega-3 - DHA
0.012g
0g
N/A
Macronutrient Comparison
Macronutrient breakdown side-by-side comparison
2
10%
6%
48%
35%
2%
Protein:
9.5 g
Fats:
6 g
Carbs:
47.8 g
Water:
34.7 g
Other:
2 g
3
40%
8%
41%
5%
6%
Protein:
40.44 g
Fats:
7.61 g
Carbs:
41.22 g
Water:
5.08 g
Other:
5.65 g
Contains
more
Carbs Carbs
+16%
Contains
more
Water Water
+583.1%
Contains
more
Protein Protein
+325.7%
Contains
more
Fats Fats
+26.8%
Contains
more
Other Other
+182.5%
Fat Type Comparison
Fat type breakdown side-by-side comparison
1
32%
46%
22%
Saturated fat:
Sat. Fat
1.593 g
Monounsaturated fat:
Mono. Fat
2.302 g
Polyunsaturated fat:
Poly. Fat
1.106 g
2
19%
81%
Saturated fat:
Sat. Fat
1.001 g
Monounsaturated fat:
Mono. Fat
4.309 g
Polyunsaturated fat:
Poly. Fat
0.017 g
Contains
more
Poly. Fat Polyunsaturated fat
+6405.9%
Contains
less
Sat. Fat Saturated fat
-37.2%
Contains
more
Mono. Fat Monounsaturated fat
+87.2%