Egg McMUFFIN vs. McDonald's Filet-O-Fish — Health Impact and Nutrition Comparison


Summary
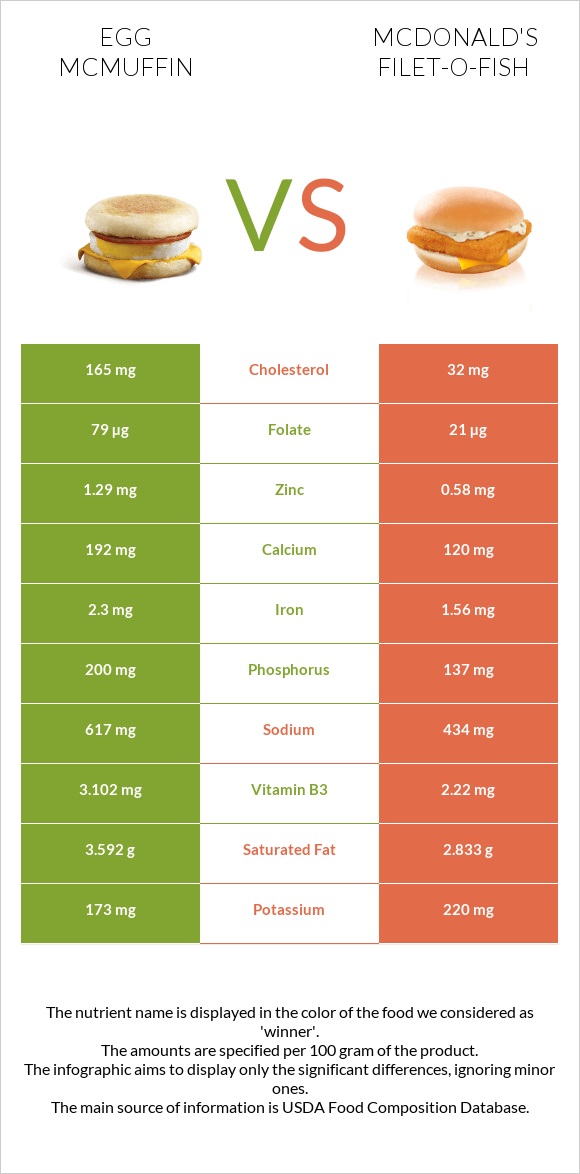
Egg McMuffin is richer in most B complex vitamins, zinc, phosphorus, iron, calcium, copper, and proteins. In comparison, filet-o-fish is richer in vitamin B12 and selenium. Filet-o-fish is higher in carbs and calories, and egg McMuffin is higher in sodium and cholesterol. Noting that both are high in sodium.
Introduction
This text is a comparison between 2 types of foods that are available on the McDonald’s menu; The Egg McMuffin and the Filet-o-fish.
The Egg McMuffin is made of an English muffin bun, an egg, Canadian bacon, and American cheddar cheese. The filet-o-fish is made from an Alaskan pollock fish filet, American cheddar cheese, and tartar sauce in a starchy steamed bun.
This article will focus on both foods according to their nutritional content and health impacts.
People can consume filet-o-fish following the pescatarian diet. In comparison, the Egg McMuffin can be consumed by people following a vegetarian diet.
Nutritional content comparison
This section will compare these fast foods based on 100g of each. However, it is important to know the serving size for each one of them.
The serving size of an egg McMuffin is 126g, and the serving size of a filet-o-fish is 134g.
Calories
Filet-o-fish is higher in calories compared to Egg McMuffin. Filet-o-fish contains 282 calories per 100g. In comparison, Egg McMuffin contains 228 calories.
Carbs
Filet-o-fish contains 26.4g of carbs. In comparison, Egg McMuffin contains 21.7g of carbs. They are both high in carbs; however, egg McMuffin contains fewer carbs.
Proteins
Both contain a decent amount of protein, considering they are fast foods. Egg McMuffin is richer in protein in comparison to filet-o-fish. It contains 13.6g of protein, whereas filet-o-fish contains 11.3g of protein.
Fats
Filet-o-fish contains 1.7 times more fats compared to egg McMuffin.
Noting that egg McMuffin contains five times more cholesterol than filet-o-fish.
It contains 165mg of cholesterol compared to filet-o-fish, which contains 32mg. In addition, egg McMuffin has a slightly higher saturated fat content.
Minerals
Egg McMuffin is richer in zinc, phosphorus, iron, calcium, and copper. However, it is higher in sodium.
In comparison, filet-o-fish is richer in selenium. Note that filet-o-fish is mineral-dense, but egg McMuffin contains more minerals.
They are both high in sodium.
It is best to visualize their mineral distribution according to the diagrams below.
Mineral Comparison
Contains
more
CalciumCalcium
+60%
Contains
more
IronIron
+47.4%
Contains
more
CopperCopper
+27.3%
Contains
more
ZincZinc
+122.4%
Contains
more
PhosphorusPhosphorus
+46%
Contains
more
MagnesiumMagnesium
+35%
Contains
more
PotassiumPotassium
+27.2%
Contains
less
SodiumSodium
-29.7%
Contains
more
ManganeseManganese
+11.5%
Vitamins
Egg McMuffin is richer in most vitamin B complex except vitamin B12. It is richer in vitamins B1, B2, B3, B5, B6, Folate.
In comparison, filet-o-fish is richer in vitamins B12 and E. It is best to visualize their vitamin distribution according to the diagrams below.
Vitamin Comparison
Contains
more
Vitamin CVitamin C
+300%
Contains
more
Vitamin B1Vitamin B1
+24.2%
Contains
more
Vitamin B2Vitamin B2
+183.1%
Contains
more
Vitamin B3Vitamin B3
+39.7%
Contains
more
Vitamin B5Vitamin B5
+∞%
Contains
more
Vitamin B6Vitamin B6
+∞%
Contains
more
FolateFolate
+276.2%
Contains
more
Vitamin EVitamin E
+98.3%
Health impacts
Cardiovascular health
One of the main concerns is the sodium amount in both these foods. They are very high in sodium, and nearly one serving of each combined can surpass the daily RDV of sodium.
High sodium intake poses a high risk of developing hypertension, increasing cardiovascular disease morbidity rates (1)(2). You should try consuming foods lower in sodium if you have blood pressure problems.
Egg McMuffin is relatively higher in cholesterol. However, recent meta-analytic studies have shown that dietary cholesterol is not the only factor associated with increased risks of hyperlipidemia and overall mortality rates. High calories, saturated fats, trans fats, and cholesterol are associated with hyperlipidemia. Mentioning that if you consume 100mg of dietary cholesterol, a small portion of it gets absorbed. (3)(4)
Generalities
These foods are dense in minerals and vitamins, as well as proteins. However, it is important not to rely on these foods daily since they don't provide adequate amounts of fiber and are high in sodium.
References

Infographic
All nutrients comparison - raw data values
| Nutrient | |
|
DV% diff. |
| Selenium | 25.5µg | 46% | |
| Vitamin B12 | 1.08µg | 45% | |
| Cholesterol | 165mg | 32mg | 44% |
| Polyunsaturated fat | 1.735g | 5.952g | 28% |
| Vitamin B2 | 0.368mg | 0.13mg | 18% |
| Vitamin B5 | 0.836mg | 17% | |
| Folate | 79µg | 21µg | 15% |
| Vitamin B6 | 0.145mg | 11% | |
| Iron | 2.3mg | 1.56mg | 9% |
| Phosphorus | 200mg | 137mg | 9% |
| Fats | 9.66g | 14.64g | 8% |
| Sodium | 617mg | 434mg | 8% |
| Calcium | 192mg | 120mg | 7% |
| Zinc | 1.29mg | 0.58mg | 6% |
| Vitamin B3 | 3.102mg | 2.22mg | 6% |
| Protein | 13.64g | 11.26g | 5% |
| Vitamin E | 0.59mg | 1.17mg | 4% |
| Vitamin B1 | 0.262mg | 0.211mg | 4% |
| Vitamin K | 4.9µg | 4% | |
| Calories | 228kcal | 282kcal | 3% |
| Saturated fat | 3.592g | 2.833g | 3% |
| Monounsaturated fat | 2.721g | 4.005g | 3% |
| Carbs | 21.67g | 26.39g | 2% |
| Magnesium | 20mg | 27mg | 2% |
| Copper | 0.084mg | 0.066mg | 2% |
| Fructose | 0.43g | 1.93g | 2% |
| Vitamin C | 1.2mg | 0.3mg | 1% |
| Potassium | 173mg | 220mg | 1% |
| Fiber | 1.1g | 1.4g | 1% |
| Manganese | 0.235mg | 0.262mg | 1% |
| Protein per 100 calories | 6g | 4g | N/A |
| Calories per 10 g protein | 167kcal | 250kcal | N/A |
| Weight per 100 calories | 44g | 35g | N/A |
| Unsaturated / Saturated Fat ratio | 1.2 | 3.5 | N/A |
| Net carbs | 20.57g | 24.99g | N/A |
| Sugar | 2.13g | 3.67g | N/A |
| Trans fat | 0.109g | 0.128g | N/A |
| Omega-3 - EPA | 0.002g | 0.03g | N/A |
| Omega-3 - DHA | 0.021g | 0.061g | N/A |
| Omega-3 - ALA | 0.114g | 0.614g | N/A |
| Omega-3 - DPA | 0.006g | 0.005g | N/A |
| Omega-3 - Eicosatrienoic acid | 0.002g | 0g | N/A |
| Omega-6 - Gamma-linoleic acid | 0.001g | 0.024g | N/A |
| Omega-6 - Dihomo-gamma-linoleic acid | 0.012g | 0.006g | N/A |
| Omega-6 - Eicosadienoic acid | 0.01g | 0.007g | N/A |
| Omega-6 - Linoleic acid | 1.416g | 5.106g | N/A |
Macronutrient Comparison
| Contains more ProteinProtein | +21.1% |
| Contains more WaterWater | +14.9% |
| Contains more OtherOther | +25.6% |
| Contains more FatsFats | +51.6% |
| Contains more CarbsCarbs | +21.8% |
Fat Type Comparison
| Contains less Sat. FatSaturated fat | -21.1% |
| Contains more Mono. FatMonounsaturated fat | +47.2% |
| Contains more Poly. FatPolyunsaturated fat | +243.1% |
Carbohydrate type comparison
| Contains more SucroseSucrose | +300% |
| Contains more LactoseLactose | +65% |
| Contains more MaltoseMaltose | +32.6% |
| Contains more GlucoseGlucose | +150% |
| Contains more FructoseFructose | +348.8% |
People also compare


References
All the values for which the sources are not specified explicitly are taken from FDA’s Food Central. The exact link to the food presented on this page can be found below.
- Egg McMUFFIN - https://fdc.nal.usda.gov/fdc-app.html#/food-details/173307/nutrients
- McDonald's Filet-O-Fish - https://fdc.nal.usda.gov/fdc-app.html#/food-details/170319/nutrients
All the Daily Values are presented for males aged 31-50, for 2000-calorie diets.