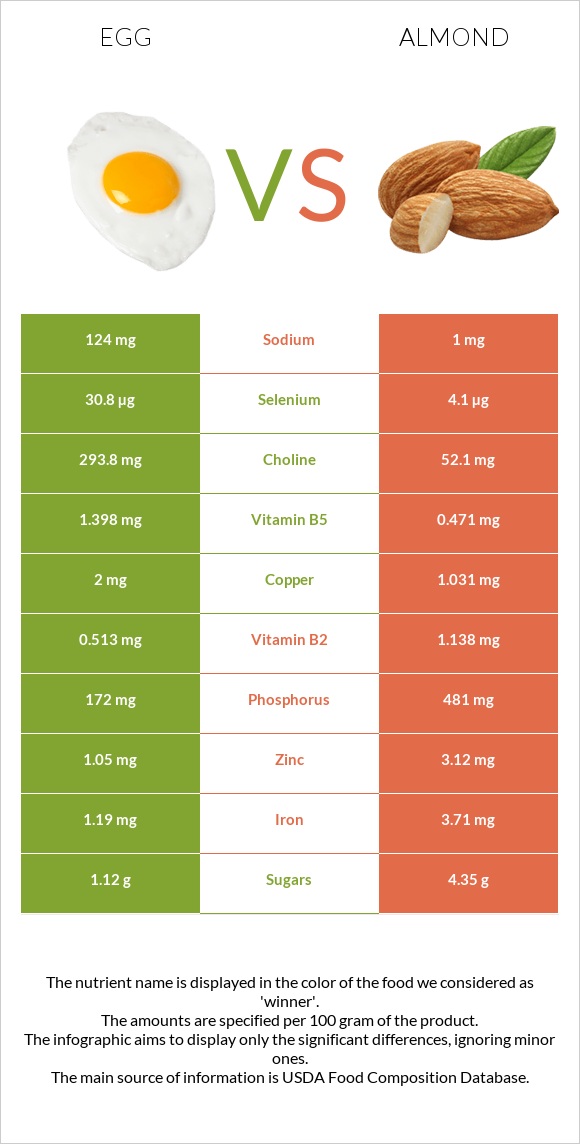
Significant differences between eggs and almonds Eggs have more copper, selenium, and vitamin B12; however, almonds are richer in vitamin E, manganese, magnesium, fiber, vitamin B2, and phosphorus. Almonds cover your daily vitamin E needs 164% more than eggs. Specific food types used in this comparison are Egg, whole, cooked, hard-boiled and Nuts, almonds .
Infographic
Mineral Comparison
Mineral comparison score is based on the number of minerals by which one or the other food is richer. The "coverage" charts below show how much of the daily needs can be covered by 300 grams of the food.
2
100 g
300 g
1 tbsp - 8.5g 1 large - 50g 1 cup, chopped - 136g
Magnesium
Magnesium
Calcium
Calcium
Potassium
Potassium
Iron
Iron
Copper
Copper
Zinc
Zinc
Phosphorus
Phosphorus
Sodium
Sodium
Manganese
Manganese
Selenium
Selenium
7.1%
15%
11%
45%
667%
29%
74%
16%
3.4%
168%
8
100 g
300 g
1 almond - 1.2g 1 oz (23 whole kernels) - 28.35g 1 cup, sliced - 92g 1 cup, ground - 95g 1 cup, slivered - 108g 1 cup, whole - 143g
Magnesium
Magnesium
Calcium
Calcium
Potassium
Potassium
Iron
Iron
Copper
Copper
Zinc
Zinc
Phosphorus
Phosphorus
Sodium
Sodium
Manganese
Manganese
Selenium
Selenium
193%
81%
65%
139%
344%
85%
206%
0.13%
284%
22%
Vitamin Comparison
Vitamin comparison score is based on the number of vitamins by which one or the other food is richer. The "coverage" charts below show how much of the daily needs can be covered by 300 grams of the food.
5
100 g
300 g
1 tbsp - 8.5g 1 large - 50g 1 cup, chopped - 136g
Vitamin C
Vit. C
Vitamin D
Vit. D
Vitamin A
Vit. A
Vitamin E
Vit. E
Vitamin B1
Vit. B1
Vitamin B2
Vit. B2
Vitamin B3
Vit. B3
Vitamin B5
Vit. B5
Vitamin B6
Vit. B6
Vitamin B12
Vit. B12
Vitamin K
Vit. K
Folate
Folate
0%
33%
50%
21%
17%
118%
1.2%
84%
28%
139%
0.75%
33%
5
100 g
300 g
1 almond - 1.2g 1 oz (23 whole kernels) - 28.35g 1 cup, sliced - 92g 1 cup, ground - 95g 1 cup, slivered - 108g 1 cup, whole - 143g
Vitamin C
Vit. C
Vitamin D
Vit. D
Vitamin A
Vit. A
Vitamin E
Vit. E
Vitamin B1
Vit. B1
Vitamin B2
Vit. B2
Vitamin B3
Vit. B3
Vitamin B5
Vit. B5
Vitamin B6
Vit. B6
Vitamin B12
Vit. B12
Vitamin K
Vit. K
Folate
Folate
0%
0%
0%
513%
51%
263%
68%
28%
32%
0%
0%
33%
All nutrients comparison - raw data values
Nutrient
DV% diff.
Vitamin E
1.03mg
25.63mg
164%
Cholesterol
373mg
0mg
124%
Copper
2mg
1.031mg
108%
Manganese
0.026mg
2.179mg
94%
Polyunsaturated fat
1.414g
12.329g
73%
Monounsaturated fat
4.077g
31.551g
69%
Magnesium
10mg
270mg
62%
Fats
10.61g
49.93g
60%
Fiber
0g
12.5g
50%
Selenium
30.8µg
4.1µg
49%
Vitamin B2
0.513mg
1.138mg
48%
Vitamin B12
1.11µg
0µg
46%
Phosphorus
172mg
481mg
44%
Choline
293.8mg
52.1mg
44%
Iron
1.19mg
3.71mg
32%
Calcium
50mg
269mg
22%
Vitamin B3
0.064mg
3.618mg
22%
Calories
155kcal
579kcal
21%
Zinc
1.05mg
3.12mg
19%
Vitamin B5
1.398mg
0.471mg
19%
Potassium
126mg
733mg
18%
Protein
12.58g
21.15g
17%
Vitamin A
149µg
0µg
17%
Vitamin B1
0.066mg
0.205mg
12%
Vitamin D*
87 IU
0 IU
11%
Vitamin D
2.2µg
0µg
11%
Carbs
1.12g
21.55g
7%
Sodium
124mg
1mg
5%
Saturated fat
3.267g
3.802g
2%
Vitamin B6
0.121mg
0.137mg
1%
Protein per 100 calories
8.1g
3.7g
N/A
Calories per 10 g protein
123kcal
274kcal
N/A
Weight per 100 calories
65g
17g
N/A
Unsaturated / Saturated Fat ratio
1.7
12
N/A
Net carbs
1.12g
9.05g
N/A
Sugar
1.12g
4.35g
N/A
Starch
0.72g
0%
Vitamin K
0.3µg
0µg
0%
Folate
44µg
44µg
0%
Trans fat
0.015g
N/A
Tryptophan
0.153mg
0.211mg
0%
Threonine
0.604mg
0.601mg
0%
Isoleucine
0.686mg
0.751mg
0%
Leucine
1.075mg
1.473mg
0%
Lysine
0.904mg
0.568mg
0%
Methionine
0.392mg
0.157mg
0%
Phenylalanine
0.668mg
1.132mg
0%
Valine
0.767mg
0.855mg
0%
Histidine
0.298mg
0.539mg
0%
Fructose
0.11g
0%
Omega-3 - EPA
0.005g
0g
N/A
Omega-3 - DHA
0.038g
0g
N/A
Omega-3 - ALA
0.003g
N/A
Omega-6 - Eicosadienoic acid
0.002g
N/A
Omega-6 - Linoleic acid
12.32g
N/A
Macronutrient Comparison
Macronutrient breakdown side-by-side comparison
1
13%
11%
75%
Protein:
12.58 g
Fats:
10.61 g
Carbs:
1.12 g
Water:
74.62 g
Other:
1.07 g
4
21%
50%
22%
4%
3%
Protein:
21.15 g
Fats:
49.93 g
Carbs:
21.55 g
Water:
4.41 g
Other:
2.96 g
Contains
more
Water Water
+1592.1%
Contains
more
Protein Protein
+68.1%
Contains
more
Fats Fats
+370.6%
Contains
more
Carbs Carbs
+1824.1%
Contains
more
Other Other
+176.6%
Fat Type Comparison
Fat type breakdown side-by-side comparison
1
37%
47%
16%
Saturated fat:
Sat. Fat
3.267 g
Monounsaturated fat:
Mono. Fat
4.077 g
Polyunsaturated fat:
Poly. Fat
1.414 g
2
8%
66%
26%
Saturated fat:
Sat. Fat
3.802 g
Monounsaturated fat:
Mono. Fat
31.551 g
Polyunsaturated fat:
Poly. Fat
12.329 g
Contains
less
Sat. Fat Saturated fat
-14.1%
Contains
more
Mono. Fat Monounsaturated fat
+673.9%
Contains
more
Poly. Fat Polyunsaturated fat
+771.9%