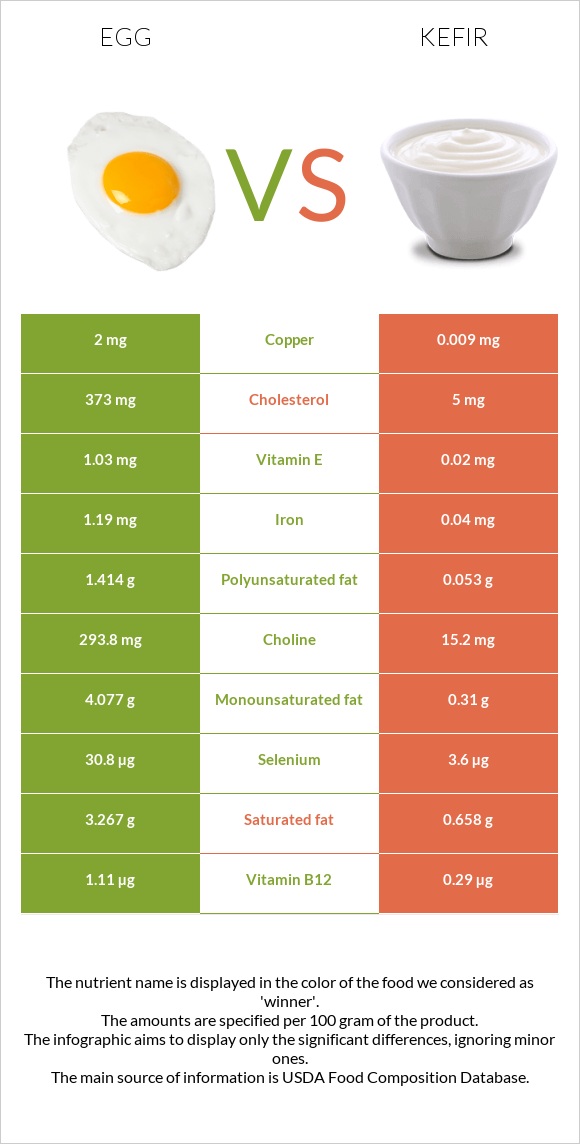
How are eggs and kefir different? Kefir contains less copper, choline, selenium, vitamin B12, vitamin B2, vitamin B5, iron, and phosphorus than eggs. Eggs cover your daily need for copper, 221% more than kefir. Eggs have 75 times more cholesterol than kefir. Eggs have 373mg of cholesterol, while kefir has 5mg. Kefir has a higher glycemic index. The glycemic index of kefir is 36, while the glycemic index of eggs is 0. Egg, whole, cooked, hard-boiled and Kefir, lowfat, plain, LIFEWAY types were used in this article.
Infographic
Mineral Comparison
Mineral comparison score is based on the number of minerals by which one or the other food is richer. The "coverage" charts below show how much of the daily needs can be covered by 300 grams of the food.
6
100 g
300 g
1 tbsp - 8.5g 1 large - 50g 1 cup, chopped - 136g
Magnesium
Magnesium
Calcium
Calcium
Potassium
Potassium
Iron
Iron
Copper
Copper
Zinc
Zinc
Phosphorus
Phosphorus
Sodium
Sodium
Manganese
Manganese
Selenium
Selenium
7.1%
15%
11%
45%
667%
29%
74%
16%
3.4%
168%
4
100 g
300 g
Magnesium
Magnesium
Calcium
Calcium
Potassium
Potassium
Iron
Iron
Copper
Copper
Zinc
Zinc
Phosphorus
Phosphorus
Sodium
Sodium
Manganese
Manganese
Selenium
Selenium
8.6%
39%
14%
1.5%
3%
13%
45%
5.2%
0.65%
20%
Vitamin Comparison
Vitamin comparison score is based on the number of vitamins by which one or the other food is richer. The "coverage" charts below show how much of the daily needs can be covered by 300 grams of the food.
9
100 g
300 g
1 tbsp - 8.5g 1 large - 50g 1 cup, chopped - 136g
Vitamin C
Vit. C
Vitamin D
Vit. D
Vitamin A
Vit. A
Vitamin E
Vit. E
Vitamin B1
Vit. B1
Vitamin B2
Vit. B2
Vitamin B3
Vit. B3
Vitamin B5
Vit. B5
Vitamin B6
Vit. B6
Vitamin B12
Vit. B12
Vitamin K
Vit. K
Folate
Folate
0%
33%
50%
21%
17%
118%
1.2%
84%
28%
139%
0.75%
33%
3
100 g
300 g
Vitamin C
Vit. C
Vitamin D
Vit. D
Vitamin A
Vit. A
Vitamin E
Vit. E
Vitamin B1
Vit. B1
Vitamin B2
Vit. B2
Vitamin B3
Vit. B3
Vitamin B5
Vit. B5
Vitamin B6
Vit. B6
Vitamin B12
Vit. B12
Vitamin K
Vit. K
Folate
Folate
0.67%
15%
57%
0.4%
7.5%
31%
2.8%
23%
13%
36%
0.25%
9.8%
All nutrients comparison - raw data values
Nutrient
DV% diff.
Copper
2mg
0.009mg
221%
Cholesterol
373mg
5mg
123%
Choline
293.8mg
15.2mg
51%
Selenium
30.8µg
3.6µg
49%
Vitamin B12
1.11µg
0.29µg
34%
Vitamin B2
0.513mg
0.135mg
29%
Vitamin B5
1.398mg
0.385mg
20%
Protein
12.58g
3.79g
18%
Fats
10.61g
0.93g
15%
Iron
1.19mg
0.04mg
14%
Saturated fat
3.267g
0.658g
12%
Phosphorus
172mg
105mg
10%
Monounsaturated fat
4.077g
0.31g
9%
Polyunsaturated fat
1.414g
0.053g
9%
Calcium
50mg
130mg
8%
Folate
44µg
13µg
8%
Vitamin E
1.03mg
0.02mg
7%
Calories
155kcal
41kcal
6%
Vitamin D*
87 IU
41 IU
6%
Vitamin D
2.2µg
1µg
6%
Zinc
1.05mg
0.46mg
5%
Vitamin B6
0.121mg
0.058mg
5%
Sodium
124mg
40mg
4%
Vitamin B1
0.066mg
0.03mg
3%
Vitamin A
149µg
171µg
2%
Carbs
1.12g
4.48g
1%
Potassium
126mg
164mg
1%
Manganese
0.026mg
0.005mg
1%
Vitamin B3
0.064mg
0.15mg
1%
Protein per 100 calories
8.1g
9.2g
N/A
Calories per 10 g protein
123kcal
108kcal
N/A
Weight per 100 calories
65g
244g
N/A
Unsaturated / Saturated Fat ratio
1.7
0.55
N/A
Vitamin C
0mg
0.2mg
0%
Net carbs
1.12g
4.48g
N/A
Magnesium
10mg
12mg
0%
Sugar
1.12g
4.61g
N/A
Vitamin K
0.3µg
0.1µg
0%
Trans fat
0.037g
N/A
Tryptophan
0.153mg
0%
Threonine
0.604mg
0%
Isoleucine
0.686mg
0%
Leucine
1.075mg
0%
Lysine
0.904mg
0%
Methionine
0.392mg
0%
Phenylalanine
0.668mg
0%
Valine
0.767mg
0%
Histidine
0.298mg
0%
Omega-3 - EPA
0.005g
0g
N/A
Omega-3 - DHA
0.038g
0g
N/A
Omega-3 - ALA
0.006g
N/A
Omega-3 - DPA
0g
0.001g
N/A
Omega-6 - Dihomo-gamma-linoleic acid
0.002g
N/A
Omega-6 - Linoleic acid
0.029g
N/A
Macronutrient Comparison
Macronutrient breakdown side-by-side comparison
3
13%
11%
75%
Protein:
12.58 g
Fats:
10.61 g
Carbs:
1.12 g
Water:
74.62 g
Other:
1.07 g
2
4%
4%
90%
Protein:
3.79 g
Fats:
0.93 g
Carbs:
4.48 g
Water:
90.07 g
Other:
0.73 g
Contains
more
Protein Protein
+231.9%
Contains
more
Fats Fats
+1040.9%
Contains
more
Other Other
+46.6%
Contains
more
Carbs Carbs
+300%
Contains
more
Water Water
+20.7%
Fat Type Comparison
Fat type breakdown side-by-side comparison
2
37%
47%
16%
Saturated fat:
Sat. Fat
3.267 g
Monounsaturated fat:
Mono. Fat
4.077 g
Polyunsaturated fat:
Poly. Fat
1.414 g
1
64%
30%
5%
Saturated fat:
Sat. Fat
0.658 g
Monounsaturated fat:
Mono. Fat
0.31 g
Polyunsaturated fat:
Poly. Fat
0.053 g
Contains
more
Mono. Fat Monounsaturated fat
+1215.2%
Contains
more
Poly. Fat Polyunsaturated fat
+2567.9%
Contains
less
Sat. Fat Saturated fat
-79.9%