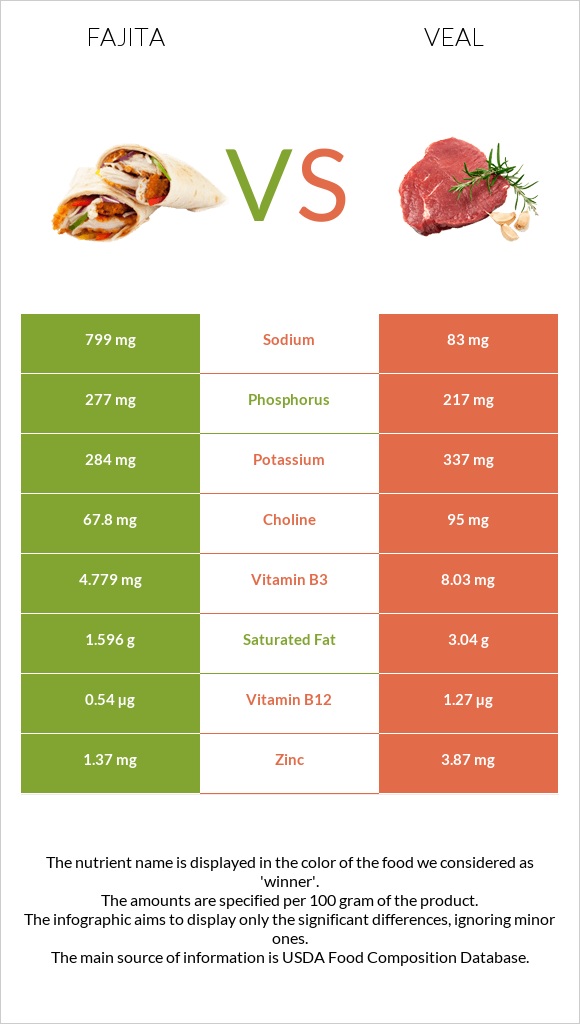
What are the main differences between fajita and veal? Fajita is richer in phosphorus and selenium, yet veal is richer in vitamin B12, zinc, vitamin B3, vitamin B5, and copper. Fajita's daily need coverage for sodium is 31% higher. Veal contains less sodium. Veal has a lower glycemic index than fajita. We used USDA Commodity, chicken fajita strips, frozen and Veal, ground, cooked, broiled types in this comparison.
Infographic
Mineral Comparison
Mineral comparison score is based on the number of minerals by which one or the other food is richer. The "coverage" charts below show how much of the daily needs can be covered by 300 grams of the food.
3
100 g
300 g
1 strip - 9.4g
Magnesium
Magnesium
Calcium
Calcium
Potassium
Potassium
Iron
Iron
Copper
Copper
Zinc
Zinc
Phosphorus
Phosphorus
Sodium
Sodium
Manganese
Manganese
Selenium
Selenium
16%
3.9%
25%
37%
10%
37%
119%
104%
8.6%
91%
5
100 g
300 g
3 oz - 85g 1 unit, cooked (yield from 1 lb raw meat) - 299g
Magnesium
Magnesium
Calcium
Calcium
Potassium
Potassium
Iron
Iron
Copper
Copper
Zinc
Zinc
Phosphorus
Phosphorus
Sodium
Sodium
Manganese
Manganese
Selenium
Selenium
17%
5.1%
30%
37%
34%
106%
93%
11%
4.6%
75%
Vitamin Comparison
Vitamin comparison score is based on the number of vitamins by which one or the other food is richer. The "coverage" charts below show how much of the daily needs can be covered by 300 grams of the food.
2
100 g
300 g
1 strip - 9.4g
Vitamin C
Vit. C
Vitamin D
Vit. D
Vitamin A
Vit. A
Vitamin E
Vit. E
Vitamin B1
Vit. B1
Vitamin B2
Vit. B2
Vitamin B3
Vit. B3
Vitamin B5
Vit. B5
Vitamin B6
Vit. B6
Vitamin B12
Vit. B12
Vitamin K
Vit. K
Folate
Folate
0%
0%
0%
4.4%
25%
49%
90%
44%
89%
68%
0.5%
3%
6
100 g
300 g
3 oz - 85g 1 unit, cooked (yield from 1 lb raw meat) - 299g
Vitamin C
Vit. C
Vitamin D
Vit. D
Vitamin A
Vit. A
Vitamin E
Vit. E
Vitamin B1
Vit. B1
Vitamin B2
Vit. B2
Vitamin B3
Vit. B3
Vitamin B5
Vit. B5
Vitamin B6
Vit. B6
Vitamin B12
Vit. B12
Vitamin K
Vit. K
Folate
Folate
0%
0%
0%
3%
18%
62%
151%
70%
90%
159%
3%
8.3%
All nutrients comparison - raw data values
Nutrient
DV% diff.
Sodium
799mg
83mg
31%
Vitamin B12
0.54µg
1.27µg
30%
Zinc
1.37mg
3.87mg
23%
Vitamin B3
4.779mg
8.03mg
20%
Protein
18.56g
24.38g
12%
Phosphorus
277mg
217mg
9%
Vitamin B5
0.726mg
1.16mg
9%
Copper
0.03mg
0.103mg
8%
Saturated fat
1.596g
3.04g
7%
Cholesterol
88mg
103mg
5%
Selenium
16.7µg
13.7µg
5%
Choline
67.8mg
95mg
5%
Vitamin B2
0.213mg
0.27mg
4%
Polyunsaturated fat
1.089g
0.55g
4%
Fats
5.73g
7.56g
3%
Vitamin B1
0.1mg
0.07mg
3%
Calories
135kcal
172kcal
2%
Potassium
284mg
337mg
2%
Folate
4µg
11µg
2%
Carbs
2.23g
0g
1%
Manganese
0.066mg
0.035mg
1%
Vitamin K
0.2µg
1.2µg
1%
Monounsaturated fat
2.333g
2.84g
1%
Protein per 100 calories
14g
14g
N/A
Calories per 10 g protein
73kcal
71kcal
N/A
Weight per 100 calories
74g
58g
N/A
Unsaturated / Saturated Fat ratio
2.1
1.1
N/A
Net carbs
2.23g
0g
N/A
Magnesium
22mg
24mg
0%
Calcium
13mg
17mg
0%
Iron
0.99mg
0.99mg
0%
Vitamin E
0.22mg
0.15mg
0%
Vitamin B6
0.387mg
0.39mg
0%
Tryptophan
0.2mg
0.247mg
0%
Threonine
0.452mg
1.065mg
0%
Isoleucine
0.813mg
1.201mg
0%
Leucine
1.56mg
1.94mg
0%
Lysine
1.857mg
2.009mg
0%
Methionine
0.552mg
0.569mg
0%
Phenylalanine
0.763mg
0.984mg
0%
Valine
0.847mg
1.347mg
0%
Histidine
0.68mg
0.885mg
0%
Omega-3 - DPA
0.007g
0g
N/A
Omega-6 - Eicosadienoic acid
0.01g
N/A
Macronutrient Comparison
Macronutrient breakdown side-by-side comparison
3
19%
6%
2%
71%
3%
Protein:
18.56 g
Fats:
5.73 g
Carbs:
2.23 g
Water:
70.6 g
Other:
2.88 g
2
24%
8%
67%
Protein:
24.38 g
Fats:
7.56 g
Carbs:
0 g
Water:
66.76 g
Other:
1.3 g
Contains
more
Carbs Carbs
+∞%
Contains
more
Other Other
+121.5%
Contains
more
Protein Protein
+31.4%
Contains
more
Fats Fats
+31.9%
Fat Type Comparison
Fat type breakdown side-by-side comparison
2
32%
46%
22%
Saturated fat:
Sat. Fat
1.596 g
Monounsaturated fat:
Mono. Fat
2.333 g
Polyunsaturated fat:
Poly. Fat
1.089 g
1
47%
44%
9%
Saturated fat:
Sat. Fat
3.04 g
Monounsaturated fat:
Mono. Fat
2.84 g
Polyunsaturated fat:
Poly. Fat
0.55 g
Contains
less
Sat. Fat Saturated fat
-47.5%
Contains
more
Poly. Fat Polyunsaturated fat
+98%
Contains
more
Mono. Fat Monounsaturated fat
+21.7%