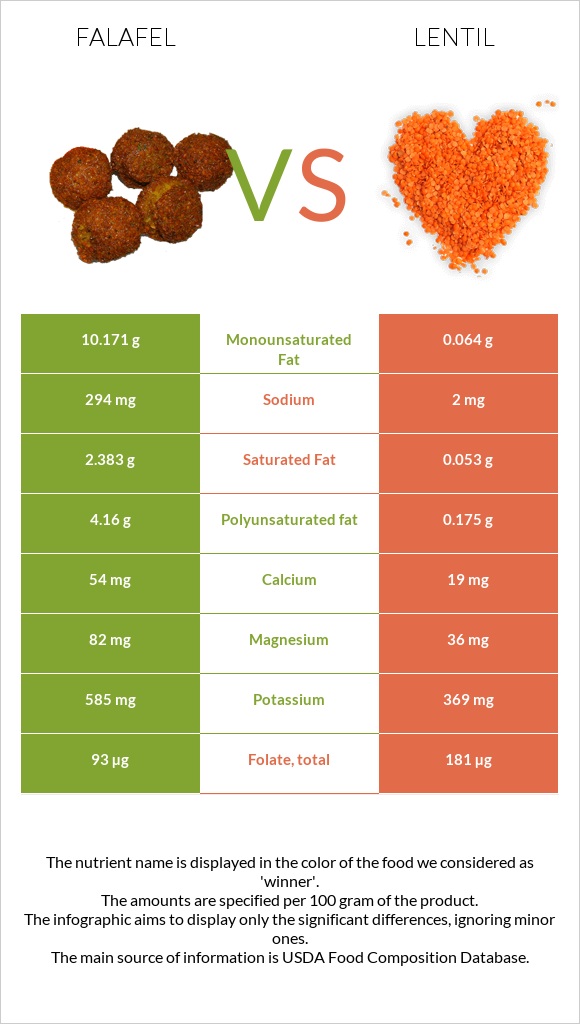
How are falafel and lentil different? Falafel is richer in magnesium, manganese, vitamin B2, potassium, and polyunsaturated fat, while lentil is higher in folate and vitamin B5. Lentil covers your daily need for folate, 22% more than falafel. Falafel contains 147 times more sodium than lentil. Falafel contains 294mg of sodium, while lentil contains 2mg. Falafel, home-prepared and Lentils, mature seeds, cooked, boiled, without salt types were used in this article.
Infographic
Mineral Comparison
Mineral comparison score is based on the number of minerals by which one or the other food is richer. The "coverage" charts below show how much of the daily needs can be covered by 300 grams of the food.
5
100 g
300 g
1 patty (approx 2-1/4" dia) - 17g
Magnesium
Magnesium
Calcium
Calcium
Potassium
Potassium
Iron
Iron
Copper
Copper
Zinc
Zinc
Phosphorus
Phosphorus
Sodium
Sodium
Manganese
Manganese
Selenium
Selenium
59%
16%
52%
128%
86%
41%
82%
38%
90%
5.5%
2
100 g
300 g
1 tbsp - 12.3g 1 cup - 198g
Magnesium
Magnesium
Calcium
Calcium
Potassium
Potassium
Iron
Iron
Copper
Copper
Zinc
Zinc
Phosphorus
Phosphorus
Sodium
Sodium
Manganese
Manganese
Selenium
Selenium
26%
5.7%
33%
125%
84%
35%
77%
0.26%
64%
15%
Vitamin Comparison
Vitamin comparison score is based on the number of vitamins by which one or the other food is richer. The "coverage" charts below show how much of the daily needs can be covered by 300 grams of the food.
2
100 g
300 g
1 patty (approx 2-1/4" dia) - 17g
Vitamin C
Vit. C
Vitamin D
Vit. D
Vitamin A
Vit. A
Vitamin E
Vit. E
Vitamin B1
Vit. B1
Vitamin B2
Vit. B2
Vitamin B3
Vit. B3
Vitamin B5
Vit. B5
Vitamin B6
Vit. B6
Vitamin B12
Vit. B12
Vitamin K
Vit. K
Folate
Folate
5.3%
0%
0.33%
0%
37%
38%
20%
18%
29%
0%
0%
70%
6
100 g
300 g
1 tbsp - 12.3g 1 cup - 198g
Vitamin C
Vit. C
Vitamin D
Vit. D
Vitamin A
Vit. A
Vitamin E
Vit. E
Vitamin B1
Vit. B1
Vitamin B2
Vit. B2
Vitamin B3
Vit. B3
Vitamin B5
Vit. B5
Vitamin B6
Vit. B6
Vitamin B12
Vit. B12
Vitamin K
Vit. K
Folate
Folate
5%
0%
0%
2.2%
42%
17%
20%
38%
41%
0%
4.3%
136%
All nutrients comparison - raw data values
Nutrient
DV% diff.
Fiber
7.9g
32%
Fats
17.8g
0.38g
27%
Polyunsaturated fat
4.16g
0.175g
27%
Monounsaturated fat
10.171g
0.064g
25%
Folate
93µg
181µg
22%
Sodium
294mg
2mg
13%
Calories
333kcal
116kcal
11%
Magnesium
82mg
36mg
11%
Saturated fat
2.383g
0.053g
11%
Protein
13.31g
9.02g
9%
Manganese
0.691mg
0.494mg
9%
Vitamin B2
0.166mg
0.073mg
7%
Vitamin B5
0.292mg
0.638mg
7%
Potassium
585mg
369mg
6%
Choline
32.7mg
6%
Carbs
31.84g
20.13g
4%
Calcium
54mg
19mg
4%
Vitamin B6
0.125mg
0.178mg
4%
Selenium
1µg
2.8µg
3%
Zinc
1.5mg
1.27mg
2%
Phosphorus
192mg
180mg
2%
Vitamin B1
0.146mg
0.169mg
2%
Iron
3.42mg
3.33mg
1%
Copper
0.258mg
0.251mg
1%
Vitamin E
0.11mg
1%
Vitamin K
1.7µg
1%
Protein per 100 calories
4g
7.8g
N/A
Calories per 10 g protein
250kcal
129kcal
N/A
Weight per 100 calories
30g
86g
N/A
Unsaturated / Saturated Fat ratio
6
4.5
N/A
Vitamin C
1.6mg
1.5mg
0%
Net carbs
31.84g
12.23g
N/A
Sugar
1.8g
N/A
Vitamin A
1µg
0µg
0%
Vitamin B3
1.044mg
1.06mg
0%
Tryptophan
0.134mg
0.081mg
0%
Threonine
0.492mg
0.323mg
0%
Isoleucine
0.567mg
0.39mg
0%
Leucine
0.944mg
0.654mg
0%
Lysine
0.856mg
0.63mg
0%
Methionine
0.187mg
0.077mg
0%
Phenylalanine
0.707mg
0.445mg
0%
Valine
0.562mg
0.448mg
0%
Histidine
0.364mg
0.254mg
0%
Macronutrient Comparison
Macronutrient breakdown side-by-side comparison
4
13%
18%
32%
35%
2%
Protein:
13.31 g
Fats:
17.8 g
Carbs:
31.84 g
Water:
34.62 g
Other:
2.43 g
1
9%
20%
70%
Protein:
9.02 g
Fats:
0.38 g
Carbs:
20.13 g
Water:
69.64 g
Other:
0.83 g
Contains
more
Protein Protein
+47.6%
Contains
more
Fats Fats
+4584.2%
Contains
more
Carbs Carbs
+58.2%
Contains
more
Other Other
+192.8%
Contains
more
Water Water
+101.2%
Fat Type Comparison
Fat type breakdown side-by-side comparison
2
14%
61%
25%
Saturated fat:
Sat. Fat
2.383 g
Monounsaturated fat:
Mono. Fat
10.171 g
Polyunsaturated fat:
Poly. Fat
4.16 g
1
18%
22%
60%
Saturated fat:
Sat. Fat
0.053 g
Monounsaturated fat:
Mono. Fat
0.064 g
Polyunsaturated fat:
Poly. Fat
0.175 g
Contains
more
Mono. Fat Monounsaturated fat
+15792.2%
Contains
more
Poly. Fat Polyunsaturated fat
+2277.1%
Contains
less
Sat. Fat Saturated fat
-97.8%