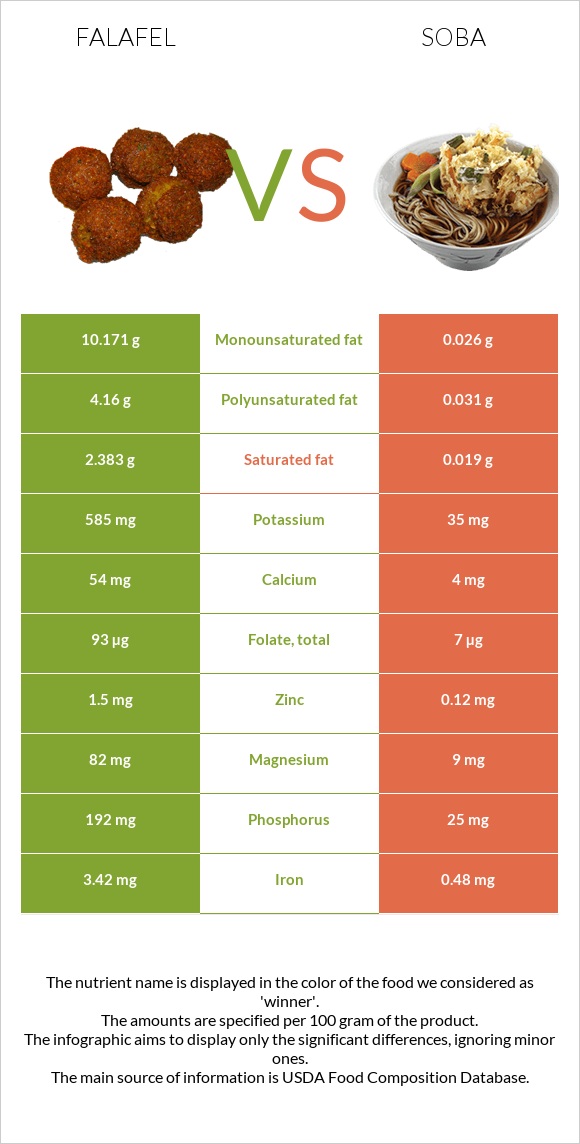
Summary of differences between falafel and soba Soba has less iron, copper, phosphorus, folate, magnesium, potassium, manganese, zinc, and vitamin B2 than falafel. Falafel covers your daily need for iron, 37% more than soba. Falafel has 125 times more saturated fat than soba. While falafel has 2.383g of saturated fat, soba has only 0.019g. The glycemic index of soba is higher. These are the specific foods used in this comparison Falafel, home-prepared and Noodles, japanese, soba, cooked .
Infographic
Mineral Comparison
Mineral comparison score is based on the number of minerals by which one or the other food is richer. The "coverage" charts below show how much of the daily needs can be covered by 300 grams of the food.
9
100 g
300 g
1 patty (approx 2-1/4" dia) - 17g
Magnesium
Magnesium
Calcium
Calcium
Potassium
Potassium
Iron
Iron
Copper
Copper
Zinc
Zinc
Phosphorus
Phosphorus
Sodium
Sodium
Manganese
Manganese
Selenium
Selenium
59%
16%
52%
128%
86%
41%
82%
38%
90%
5.5%
1
100 g
300 g
1 cup - 114g
Magnesium
Magnesium
Calcium
Calcium
Potassium
Potassium
Iron
Iron
Copper
Copper
Zinc
Zinc
Phosphorus
Phosphorus
Sodium
Sodium
Manganese
Manganese
Selenium
Selenium
6.4%
1.2%
3.1%
18%
2.7%
3.3%
11%
7.8%
49%
0%
Vitamin Comparison
Vitamin comparison score is based on the number of vitamins by which one or the other food is richer. The "coverage" charts below show how much of the daily needs can be covered by 300 grams of the food.
8
100 g
300 g
1 patty (approx 2-1/4" dia) - 17g
Vitamin C
Vit. C
Vitamin D
Vit. D
Vitamin A
Vit. A
Vitamin E
Vit. E
Vitamin B1
Vit. B1
Vitamin B2
Vit. B2
Vitamin B3
Vit. B3
Vitamin B5
Vit. B5
Vitamin B6
Vit. B6
Vitamin B12
Vit. B12
Vitamin K
Vit. K
Folate
Folate
5.3%
0%
0.33%
0%
37%
38%
20%
18%
29%
0%
0%
70%
0
100 g
300 g
1 cup - 114g
Vitamin C
Vit. C
Vitamin D
Vit. D
Vitamin A
Vit. A
Vitamin E
Vit. E
Vitamin B1
Vit. B1
Vitamin B2
Vit. B2
Vitamin B3
Vit. B3
Vitamin B5
Vit. B5
Vitamin B6
Vit. B6
Vitamin B12
Vit. B12
Vitamin K
Vit. K
Folate
Folate
0%
0%
0%
0%
24%
6%
9.6%
14%
9.2%
0%
0%
5.3%
All nutrients comparison - raw data values
Nutrient
DV% diff.
Iron
3.42mg
0.48mg
37%
Copper
0.258mg
0.008mg
28%
Polyunsaturated fat
4.16g
0.031g
28%
Fats
17.8g
0.1g
27%
Monounsaturated fat
10.171g
0.026g
25%
Phosphorus
192mg
25mg
24%
Folate
93µg
7µg
22%
Protein
13.31g
5.06g
17%
Magnesium
82mg
9mg
17%
Potassium
585mg
35mg
16%
Manganese
0.691mg
0.374mg
14%
Zinc
1.5mg
0.12mg
13%
Calories
333kcal
99kcal
12%
Vitamin B2
0.166mg
0.026mg
11%
Saturated fat
2.383g
0.019g
11%
Sodium
294mg
60mg
10%
Vitamin B6
0.125mg
0.04mg
7%
Calcium
54mg
4mg
5%
Vitamin B1
0.146mg
0.094mg
4%
Carbs
31.84g
21.44g
3%
Vitamin B3
1.044mg
0.51mg
3%
Vitamin C
1.6mg
0mg
2%
Selenium
1µg
2%
Vitamin B5
0.292mg
0.235mg
1%
Protein per 100 calories
4g
5.1g
N/A
Calories per 10 g protein
250kcal
196kcal
N/A
Weight per 100 calories
30g
101g
N/A
Unsaturated / Saturated Fat ratio
6
3
N/A
Net carbs
31.84g
21.44g
N/A
Vitamin A
1µg
0µg
0%
Tryptophan
0.134mg
0.072mg
0%
Threonine
0.492mg
0.177mg
0%
Isoleucine
0.567mg
0.195mg
0%
Leucine
0.944mg
0.33mg
0%
Lysine
0.856mg
0.214mg
0%
Methionine
0.187mg
0.072mg
0%
Phenylalanine
0.707mg
0.217mg
0%
Valine
0.562mg
0.249mg
0%
Histidine
0.364mg
0.119mg
0%
Macronutrient Comparison
Macronutrient breakdown side-by-side comparison
4
13%
18%
32%
35%
2%
Protein:
13.31 g
Fats:
17.8 g
Carbs:
31.84 g
Water:
34.62 g
Other:
2.43 g
1
5%
21%
73%
Protein:
5.06 g
Fats:
0.1 g
Carbs:
21.44 g
Water:
73.01 g
Other:
0.39 g
Contains
more
Protein Protein
+163%
Contains
more
Fats Fats
+17700%
Contains
more
Carbs Carbs
+48.5%
Contains
more
Other Other
+523.1%
Contains
more
Water Water
+110.9%
Fat Type Comparison
Fat type breakdown side-by-side comparison
2
14%
61%
25%
Saturated fat:
Sat. Fat
2.383 g
Monounsaturated fat:
Mono. Fat
10.171 g
Polyunsaturated fat:
Poly. Fat
4.16 g
1
25%
34%
41%
Saturated fat:
Sat. Fat
0.019 g
Monounsaturated fat:
Mono. Fat
0.026 g
Polyunsaturated fat:
Poly. Fat
0.031 g
Contains
more
Mono. Fat Monounsaturated fat
+39019.2%
Contains
more
Poly. Fat Polyunsaturated fat
+13319.4%
Contains
less
Sat. Fat Saturated fat
-99.2%