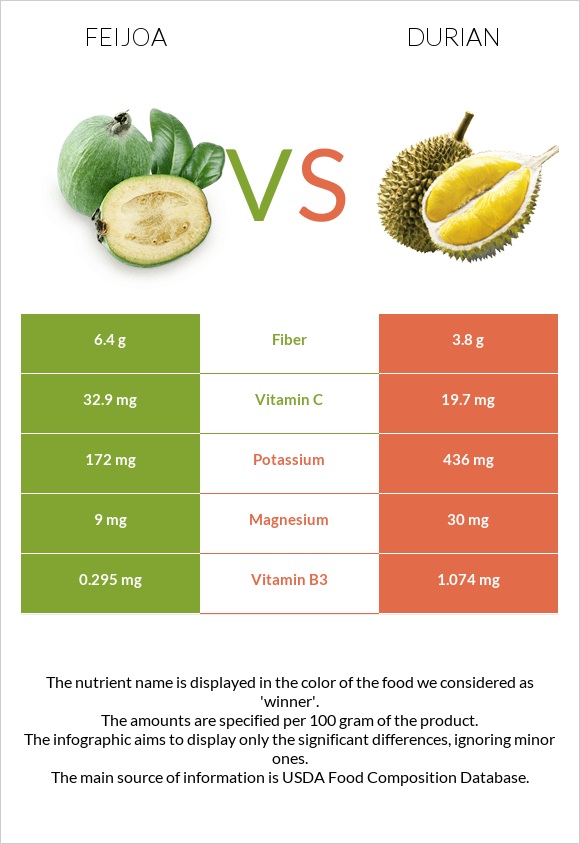
What are the main differences between feijoa and durian? Feijoa is richer in vitamin C and fiber, yet durian is richer in vitamin B1, vitamin B6, copper, vitamin B2, manganese, and potassium. Durian's daily need coverage for vitamin B1 is 31% higher. Feijoa has 2 times more fiber than durian. Feijoa has 6.4g of fiber, while durian has 3.8g. Feijoa has a lower glycemic index than durian. We used Feijoa, raw and Durian, raw or frozen types in this comparison.
Infographic
Mineral Comparison
Mineral comparison score is based on the number of minerals by which one or the other food is richer. The "coverage" charts below show how much of the daily needs can be covered by 300 grams of the food.
1
100 g
300 g
1 fruit without peel - 42g 1 cup 1/2" chunks - 205g 1 cup, pureed - 243g
Magnesium
Magnesium
Calcium
Calcium
Potassium
Potassium
Iron
Iron
Copper
Copper
Zinc
Zinc
Phosphorus
Phosphorus
Sodium
Sodium
Manganese
Manganese
Selenium
Selenium
6.4%
5.1%
15%
5.3%
12%
1.6%
8.1%
0.39%
11%
0%
8
100 g
300 g
1 cup, chopped or diced - 243g 1 fruit - 602g
Magnesium
Magnesium
Calcium
Calcium
Potassium
Potassium
Iron
Iron
Copper
Copper
Zinc
Zinc
Phosphorus
Phosphorus
Sodium
Sodium
Manganese
Manganese
Selenium
Selenium
21%
1.8%
38%
16%
69%
7.6%
17%
0.26%
42%
0%
Vitamin Comparison
Vitamin comparison score is based on the number of vitamins by which one or the other food is richer. The "coverage" charts below show how much of the daily needs can be covered by 300 grams of the food.
3
100 g
300 g
1 fruit without peel - 42g 1 cup 1/2" chunks - 205g 1 cup, pureed - 243g
Vitamin C
Vit. C
Vitamin D
Vit. D
Vitamin A
Vit. A
Vitamin E
Vit. E
Vitamin B1
Vit. B1
Vitamin B2
Vit. B2
Vitamin B3
Vit. B3
Vitamin B5
Vit. B5
Vitamin B6
Vit. B6
Vitamin B12
Vit. B12
Vitamin K
Vit. K
Folate
Folate
110%
0%
0%
3.2%
1.5%
4.2%
5.5%
14%
15%
0%
8.8%
17%
6
100 g
300 g
1 cup, chopped or diced - 243g 1 fruit - 602g
Vitamin C
Vit. C
Vitamin D
Vit. D
Vitamin A
Vit. A
Vitamin E
Vit. E
Vitamin B1
Vit. B1
Vitamin B2
Vit. B2
Vitamin B3
Vit. B3
Vitamin B5
Vit. B5
Vitamin B6
Vit. B6
Vitamin B12
Vit. B12
Vitamin K
Vit. K
Folate
Folate
66%
0%
0.67%
0%
94%
46%
20%
14%
73%
0%
0%
27%
All nutrients comparison - raw data values
Nutrient
DV% diff.
Vitamin B1
0.006mg
0.374mg
31%
Copper
0.036mg
0.207mg
19%
Vitamin B6
0.067mg
0.316mg
19%
Vitamin C
32.9mg
19.7mg
15%
Vitamin B2
0.018mg
0.2mg
14%
Fiber
6.4g
3.8g
10%
Manganese
0.084mg
0.325mg
10%
Fats
0.42g
5.33g
8%
Potassium
172mg
436mg
8%
Magnesium
9mg
30mg
5%
Vitamin B3
0.295mg
1.074mg
5%
Calories
61kcal
147kcal
4%
Carbs
15.21g
27.09g
4%
Iron
0.14mg
0.43mg
4%
Fructose
2.95g
4%
Phosphorus
19mg
39mg
3%
Vitamin K
3.5µg
3%
Folate
23µg
36µg
3%
Protein
0.71g
1.47g
2%
Zinc
0.06mg
0.28mg
2%
Calcium
17mg
6mg
1%
Vitamin E
0.16mg
1%
Polyunsaturated fat
0.136g
1%
Protein per 100 calories
1.2g
1g
N/A
Calories per 10 g protein
859kcal
1000kcal
N/A
Weight per 100 calories
164g
68g
N/A
Unsaturated / Saturated Fat ratio
1.8
N/A
Net carbs
8.81g
23.29g
N/A
Sugar
8.2g
N/A
Sodium
3mg
2mg
0%
Vitamin A
0µg
2µg
0%
Vitamin B5
0.233mg
0.23mg
0%
Saturated fat
0.104g
0%
Monounsaturated fat
0.056g
0%
Tryptophan
0.007mg
0%
Threonine
0.019mg
0%
Isoleucine
0.019mg
0%
Leucine
0.028mg
0%
Lysine
0.038mg
0%
Methionine
0.007mg
0%
Phenylalanine
0.019mg
0%
Valine
0.019mg
0%
Histidine
0.009mg
0%
Omega-3 - ALA
0.029g
N/A
Omega-6 - Linoleic acid
0.107g
N/A
Macronutrient Comparison
Macronutrient breakdown side-by-side comparison
1
15%
83%
Protein:
0.71 g
Fats:
0.42 g
Carbs:
15.21 g
Water:
83.28 g
Other:
0.38 g
4
5%
27%
65%
Protein:
1.47 g
Fats:
5.33 g
Carbs:
27.09 g
Water:
64.99 g
Other:
1.12 g
Contains
more
Water Water
+28.1%
Contains
more
Protein Protein
+107%
Contains
more
Fats Fats
+1169%
Contains
more
Carbs Carbs
+78.1%
Contains
more
Other Other
+194.7%