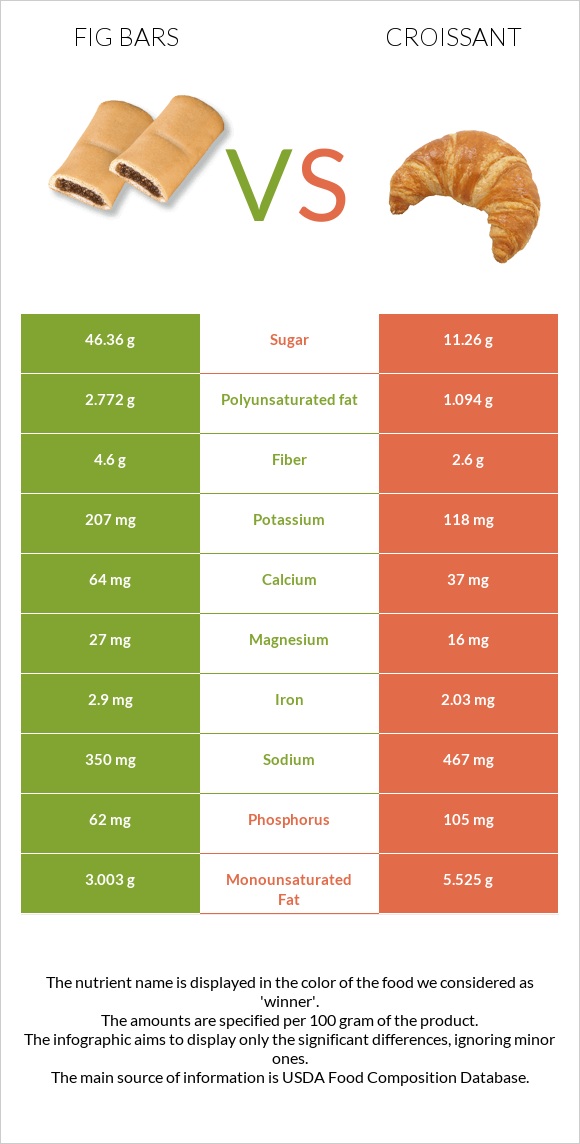
How are fig bars and croissant different? Fig bars are higher in iron, fiber, and copper; however, croissant is richer in selenium, vitamin B1, vitamin A, folate, and vitamin B5. Daily need coverage for saturated fat for croissant is 53% higher. Fig bars contain 2 times more copper than croissant. While fig bars contain 0.147mg of copper, croissant contains only 0.08mg. Fig bars have less saturated fat. Croissant has a lower glycemic index (56) than fig bars (70). Cookies, fig bars and Croissants, butter are the varieties used in this article.
Infographic
Mineral Comparison
Mineral comparison score is based on the number of minerals by which one or the other food is richer. The "coverage" charts below show how much of the daily needs can be covered by 300 grams of the food.
6
100 g
300 g
1 cookie - 16g 1 oz - 28.35g 1 Figaroo (2 square halves) - 43g 1 individual package (2 oz package containing 2 3" bars) - 57g
Magnesium
Magnesium
Calcium
Calcium
Potassium
Potassium
Iron
Iron
Copper
Copper
Zinc
Zinc
Phosphorus
Phosphorus
Sodium
Sodium
Manganese
Manganese
Selenium
Selenium
19%
19%
18%
109%
49%
11%
27%
46%
45%
18%
3
100 g
300 g
1 croissant, mini - 28g 1 oz - 28.35g 1 croissant, small - 42g 1 croissant, medium - 57g 1 croissant, large - 67g
Magnesium
Magnesium
Calcium
Calcium
Potassium
Potassium
Iron
Iron
Copper
Copper
Zinc
Zinc
Phosphorus
Phosphorus
Sodium
Sodium
Manganese
Manganese
Selenium
Selenium
11%
11%
10%
76%
27%
20%
45%
61%
43%
124%
Vitamin Comparison
Vitamin comparison score is based on the number of vitamins by which one or the other food is richer. The "coverage" charts below show how much of the daily needs can be covered by 300 grams of the food.
3
100 g
300 g
1 cookie - 16g 1 oz - 28.35g 1 Figaroo (2 square halves) - 43g 1 individual package (2 oz package containing 2 3" bars) - 57g
Vitamin C
Vit. C
Vitamin D
Vit. D
Vitamin A
Vit. A
Vitamin E
Vit. E
Vitamin B1
Vit. B1
Vitamin B2
Vit. B2
Vitamin B3
Vit. B3
Vitamin B5
Vit. B5
Vitamin B6
Vit. B6
Vitamin B12
Vit. B12
Vitamin K
Vit. K
Folate
Folate
1%
0%
3%
13%
40%
50%
35%
22%
17%
11%
15%
26%
8
100 g
300 g
1 croissant, mini - 28g 1 oz - 28.35g 1 croissant, small - 42g 1 croissant, medium - 57g 1 croissant, large - 67g
Vitamin C
Vit. C
Vitamin D
Vit. D
Vitamin A
Vit. A
Vitamin E
Vit. E
Vitamin B1
Vit. B1
Vitamin B2
Vit. B2
Vitamin B3
Vit. B3
Vitamin B5
Vit. B5
Vitamin B6
Vit. B6
Vitamin B12
Vit. B12
Vitamin K
Vit. K
Folate
Folate
0.67%
0%
69%
17%
97%
56%
41%
52%
13%
20%
4.5%
66%
All nutrients comparison - raw data values
Nutrient
DV% diff.
Saturated fat
1.123g
11.659g
48%
Selenium
3.3µg
22.7µg
35%
Cholesterol
0mg
67mg
22%
Vitamin A
9µg
206µg
22%
Fats
7.3g
21g
21%
Vitamin B1
0.158mg
0.388mg
19%
Folate
35µg
88µg
13%
Iron
2.9mg
2.03mg
11%
Polyunsaturated fat
2.772g
1.094g
11%
Vitamin B5
0.364mg
0.861mg
10%
Protein
3.7g
8.2g
9%
Carbs
70.9g
45.8g
8%
Fiber
4.6g
2.6g
8%
Copper
0.147mg
0.08mg
7%
Phosphorus
62mg
105mg
6%
Monounsaturated fat
3.003g
5.525g
6%
Sodium
350mg
467mg
5%
Choline
14.6mg
38.8mg
4%
Calories
348kcal
406kcal
3%
Magnesium
27mg
16mg
3%
Calcium
64mg
37mg
3%
Potassium
207mg
118mg
3%
Zinc
0.39mg
0.75mg
3%
Vitamin B12
0.09µg
0.16µg
3%
Vitamin K
5.8µg
1.8µg
3%
Vitamin B2
0.217mg
0.241mg
2%
Vitamin B3
1.874mg
2.188mg
2%
Vitamin E
0.65mg
0.84mg
1%
Manganese
0.343mg
0.33mg
1%
Vitamin B6
0.075mg
0.058mg
1%
Protein per 100 calories
1.1g
2g
N/A
Calories per 10 g protein
941kcal
495kcal
N/A
Weight per 100 calories
29g
25g
N/A
Unsaturated / Saturated Fat ratio
5.1
0.57
N/A
Vitamin C
0.3mg
0.2mg
0%
Net carbs
66.3g
43.2g
N/A
Sugar
46.36g
11.26g
N/A
Tryptophan
0.046mg
0.099mg
0%
Threonine
0.113mg
0.284mg
0%
Isoleucine
0.132mg
0.365mg
0%
Leucine
0.224mg
0.623mg
0%
Lysine
0.14mg
0.329mg
0%
Methionine
0.053mg
0.175mg
0%
Phenylalanine
0.145mg
0.416mg
0%
Valine
0.155mg
0.41mg
0%
Histidine
0.067mg
0.187mg
0%
Omega-3 - EPA
0g
0.003g
N/A
Omega-3 - DHA
0g
0.002g
N/A
Macronutrient Comparison
Macronutrient breakdown side-by-side comparison
1
4%
7%
71%
17%
Protein:
3.7 g
Fats:
7.3 g
Carbs:
70.9 g
Water:
16.5 g
Other:
1.6 g
4
8%
21%
46%
23%
2%
Protein:
8.2 g
Fats:
21 g
Carbs:
45.8 g
Water:
23.2 g
Other:
1.8 g
Contains
more
Carbs Carbs
+54.8%
Contains
more
Protein Protein
+121.6%
Contains
more
Fats Fats
+187.7%
Contains
more
Water Water
+40.6%
Contains
more
Other Other
+12.5%
Fat Type Comparison
Fat type breakdown side-by-side comparison
2
16%
44%
40%
Saturated fat:
Sat. Fat
1.123 g
Monounsaturated fat:
Mono. Fat
3.003 g
Polyunsaturated fat:
Poly. Fat
2.772 g
1
64%
30%
6%
Saturated fat:
Sat. Fat
11.659 g
Monounsaturated fat:
Mono. Fat
5.525 g
Polyunsaturated fat:
Poly. Fat
1.094 g
Contains
less
Sat. Fat Saturated fat
-90.4%
Contains
more
Poly. Fat Polyunsaturated fat
+153.4%
Contains
more
Mono. Fat Monounsaturated fat
+84%