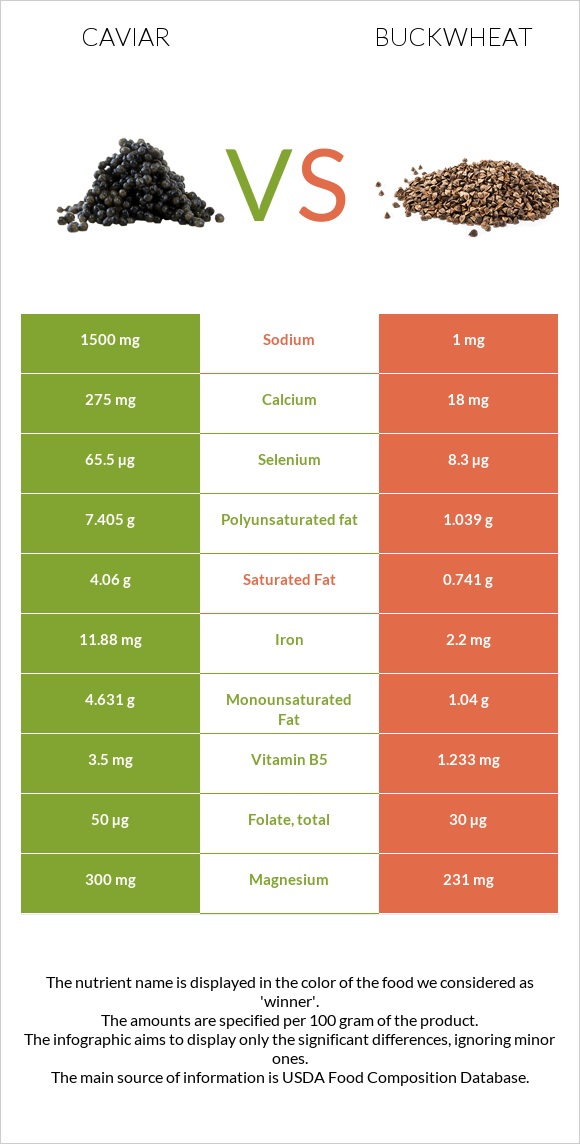
Important differences between caviar and buckwheat Caviar has more vitamin B12, iron, selenium, choline, vitamin B5, magnesium, vitamin B2, and phosphorus than buckwheat. Caviar's daily need coverage for vitamin B12 is 833% more. Buckwheat has a higher glycemic index. The glycemic index of buckwheat is 51, while the glycemic index of caviar is 0. The food varieties used in the comparison are Fish, caviar, black, and red, granular and Buckwheat groats, roasted, cooked .
Infographic
Mineral Comparison
Mineral comparison score is based on the number of minerals by which one or the other food is richer. The "coverage" charts below show how much of the daily needs can be covered by 300 grams of the food.
7
100 g
300 g
1 tbsp - 16g 1 oz - 28.35g
Magnesium
Magnesium
Calcium
Calcium
Potassium
Potassium
Iron
Iron
Copper
Copper
Zinc
Zinc
Phosphorus
Phosphorus
Sodium
Sodium
Manganese
Manganese
Selenium
Selenium
214%
83%
16%
446%
37%
26%
153%
196%
6.5%
357%
3
100 g
300 g
1 cup - 168g
Magnesium
Magnesium
Calcium
Calcium
Potassium
Potassium
Iron
Iron
Copper
Copper
Zinc
Zinc
Phosphorus
Phosphorus
Sodium
Sodium
Manganese
Manganese
Selenium
Selenium
36%
2.1%
7.8%
30%
49%
17%
30%
0.52%
53%
12%
Vitamin Comparison
Vitamin comparison score is based on the number of vitamins by which one or the other food is richer. The "coverage" charts below show how much of the daily needs can be covered by 300 grams of the food.
9
100 g
300 g
1 tbsp - 16g 1 oz - 28.35g
Vitamin C
Vit. C
Vitamin D
Vit. D
Vitamin A
Vit. A
Vitamin E
Vit. E
Vitamin B1
Vit. B1
Vitamin B2
Vit. B2
Vitamin B3
Vit. B3
Vitamin B5
Vit. B5
Vitamin B6
Vit. B6
Vitamin B12
Vit. B12
Vitamin K
Vit. K
Folate
Folate
0%
44%
90%
38%
48%
143%
2.3%
210%
74%
2500%
1.5%
38%
2
100 g
300 g
1 cup - 168g
Vitamin C
Vit. C
Vitamin D
Vit. D
Vitamin A
Vit. A
Vitamin E
Vit. E
Vitamin B1
Vit. B1
Vitamin B2
Vit. B2
Vitamin B3
Vit. B3
Vitamin B5
Vit. B5
Vitamin B6
Vit. B6
Vitamin B12
Vit. B12
Vitamin K
Vit. K
Folate
Folate
0%
0%
0%
1.8%
10%
9%
18%
22%
18%
0%
4.8%
11%
All nutrients comparison - raw data values
Nutrient
DV% diff.
Vitamin B12
20µg
0µg
833%
Cholesterol
588mg
0mg
196%
Iron
11.88mg
0.8mg
139%
Selenium
65.5µg
2.2µg
115%
Choline
490.9mg
20.1mg
86%
Sodium
1500mg
4mg
65%
Vitamin B5
3.5mg
0.359mg
63%
Magnesium
300mg
51mg
59%
Polyunsaturated fat
7.405g
0.188g
48%
Vitamin B2
0.62mg
0.039mg
45%
Protein
24.6g
3.38g
42%
Phosphorus
356mg
70mg
41%
Vitamin A
271µg
0µg
30%
Fats
17.9g
0.62g
27%
Calcium
275mg
7mg
27%
Vitamin B6
0.32mg
0.077mg
19%
Saturated fat
4.06g
0.134g
18%
Vitamin D*
117 IU
0 IU
15%
Vitamin D
2.9µg
0µg
15%
Manganese
0.05mg
0.403mg
15%
Vitamin B1
0.19mg
0.04mg
13%
Vitamin E
1.89mg
0.09mg
12%
Fiber
0g
2.7g
11%
Monounsaturated fat
4.631g
0.188g
11%
Calories
264kcal
92kcal
9%
Folate
50µg
14µg
9%
Carbs
4g
19.94g
5%
Vitamin B3
0.12mg
0.94mg
5%
Copper
0.11mg
0.146mg
4%
Potassium
181mg
88mg
3%
Zinc
0.95mg
0.61mg
3%
Vitamin K
0.6µg
1.9µg
1%
Protein per 100 calories
9.3g
3.7g
N/A
Calories per 10 g protein
107kcal
272kcal
N/A
Weight per 100 calories
38g
109g
N/A
Unsaturated / Saturated Fat ratio
3
2.8
N/A
Net carbs
4g
17.24g
N/A
Sugar
0g
0.9g
N/A
Tryptophan
0.323mg
0.049mg
0%
Threonine
1.263mg
0.129mg
0%
Isoleucine
1.035mg
0.127mg
0%
Leucine
2.133mg
0.212mg
0%
Lysine
1.834mg
0.172mg
0%
Methionine
0.646mg
0.044mg
0%
Phenylalanine
1.071mg
0.133mg
0%
Valine
1.263mg
0.173mg
0%
Histidine
0.649mg
0.079mg
0%
Fructose
0.1g
0%
Omega-3 - EPA
2.741g
0g
N/A
Omega-3 - DHA
3.8g
0g
N/A
Omega-3 - DPA
0.229g
0g
N/A
Macronutrient Comparison
Macronutrient breakdown side-by-side comparison
3
25%
18%
4%
48%
6%
Protein:
24.6 g
Fats:
17.9 g
Carbs:
4 g
Water:
47.5 g
Other:
6 g
2
3%
20%
76%
Protein:
3.38 g
Fats:
0.62 g
Carbs:
19.94 g
Water:
75.63 g
Other:
0.43 g
Contains
more
Protein Protein
+627.8%
Contains
more
Fats Fats
+2787.1%
Contains
more
Other Other
+1295.3%
Contains
more
Carbs Carbs
+398.5%
Contains
more
Water Water
+59.2%
Fat Type Comparison
Fat type breakdown side-by-side comparison
2
25%
29%
46%
Saturated fat:
Sat. Fat
4.06 g
Monounsaturated fat:
Mono. Fat
4.631 g
Polyunsaturated fat:
Poly. Fat
7.405 g
1
26%
37%
37%
Saturated fat:
Sat. Fat
0.134 g
Monounsaturated fat:
Mono. Fat
0.188 g
Polyunsaturated fat:
Poly. Fat
0.188 g
Contains
more
Mono. Fat Monounsaturated fat
+2363.3%
Contains
more
Poly. Fat Polyunsaturated fat
+3838.8%
Contains
less
Sat. Fat Saturated fat
-96.7%