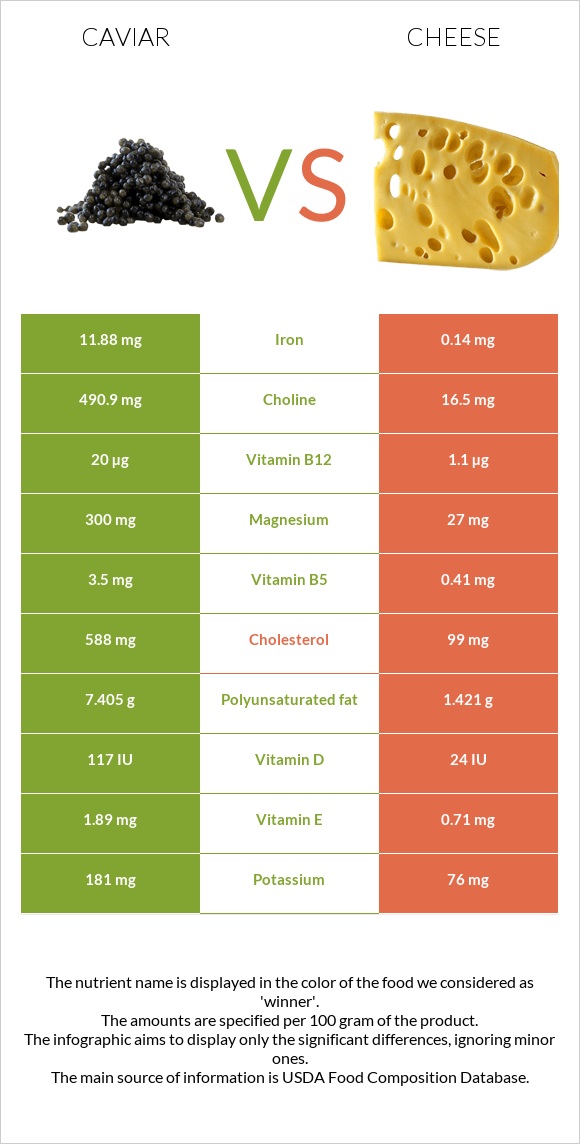
Differences between caviar and cheese Caviar has more vitamin B12, iron, choline, selenium, magnesium, and vitamin B5, while cheese has more calcium. Caviar's daily need coverage for vitamin B12 is 787% higher. Cheese contains 85 times less iron than caviar. Caviar contains 11.88mg of iron, while cheese contains 0.14mg. The amount of cholesterol in cheese is lower. The food types used in this comparison are Fish, caviar, black, and red, granular and Cheese, cheddar .
Infographic
Mineral Comparison
Mineral comparison score is based on the number of minerals by which one or the other food is richer. The "coverage" charts below show how much of the daily needs can be covered by 300 grams of the food.
6
100 g
300 g
1 tbsp - 16g 1 oz - 28.35g
Magnesium
Magnesium
Calcium
Calcium
Potassium
Potassium
Iron
Iron
Copper
Copper
Zinc
Zinc
Phosphorus
Phosphorus
Sodium
Sodium
Manganese
Manganese
Selenium
Selenium
214%
83%
16%
446%
37%
26%
153%
196%
6.5%
357%
4
100 g
300 g
1 cubic inch - 17g 1 slice (1 oz) - 28g 1 oz - 28.35g 1 cup, shredded - 113g 1 cup, diced - 132g 1 cup, melted - 244g
Magnesium
Magnesium
Calcium
Calcium
Potassium
Potassium
Iron
Iron
Copper
Copper
Zinc
Zinc
Phosphorus
Phosphorus
Sodium
Sodium
Manganese
Manganese
Selenium
Selenium
19%
213%
6.7%
5.3%
10%
99%
195%
85%
3.5%
155%
Vitamin Comparison
Vitamin comparison score is based on the number of vitamins by which one or the other food is richer. The "coverage" charts below show how much of the daily needs can be covered by 300 grams of the food.
9
100 g
300 g
1 tbsp - 16g 1 oz - 28.35g
Vitamin C
Vit. C
Vitamin D
Vit. D
Vitamin A
Vit. A
Vitamin E
Vit. E
Vitamin B1
Vit. B1
Vitamin B2
Vit. B2
Vitamin B3
Vit. B3
Vitamin B5
Vit. B5
Vitamin B6
Vit. B6
Vitamin B12
Vit. B12
Vitamin K
Vit. K
Folate
Folate
0%
44%
90%
38%
48%
143%
2.3%
210%
74%
2500%
1.5%
38%
2
100 g
300 g
1 cubic inch - 17g 1 slice (1 oz) - 28g 1 oz - 28.35g 1 cup, shredded - 113g 1 cup, diced - 132g 1 cup, melted - 244g
Vitamin C
Vit. C
Vitamin D
Vit. D
Vitamin A
Vit. A
Vitamin E
Vit. E
Vitamin B1
Vit. B1
Vitamin B2
Vit. B2
Vitamin B3
Vit. B3
Vitamin B5
Vit. B5
Vitamin B6
Vit. B6
Vitamin B12
Vit. B12
Vitamin K
Vit. K
Folate
Folate
0%
9%
110%
14%
7.3%
99%
1.1%
25%
15%
138%
6%
20%
All nutrients comparison - raw data values
Nutrient
DV% diff.
Vitamin B12
20µg
1.1µg
788%
Cholesterol
588mg
99mg
163%
Iron
11.88mg
0.14mg
147%
Choline
490.9mg
16.5mg
86%
Selenium
65.5µg
28.5µg
67%
Saturated fat
4.06g
18.867g
67%
Magnesium
300mg
27mg
65%
Vitamin B5
3.5mg
0.41mg
62%
Calcium
275mg
710mg
44%
Polyunsaturated fat
7.405g
1.421g
40%
Sodium
1500mg
653mg
37%
Fats
17.9g
33.31g
24%
Zinc
0.95mg
3.64mg
24%
Vitamin B6
0.32mg
0.066mg
20%
Vitamin B2
0.62mg
0.428mg
15%
Phosphorus
356mg
455mg
14%
Vitamin B1
0.19mg
0.029mg
13%
Vitamin D*
117 IU
24 IU
12%
Vitamin D
2.9µg
0.6µg
12%
Monounsaturated fat
4.631g
9.246g
12%
Copper
0.11mg
0.03mg
9%
Vitamin E
1.89mg
0.71mg
8%
Calories
264kcal
404kcal
7%
Vitamin A
271µg
330µg
7%
Folate
50µg
27µg
6%
Protein
24.6g
22.87g
3%
Potassium
181mg
76mg
3%
Vitamin K
0.6µg
2.4µg
2%
Manganese
0.05mg
0.027mg
1%
Protein per 100 calories
9.3g
5.7g
N/A
Calories per 10 g protein
107kcal
177kcal
N/A
Weight per 100 calories
38g
25g
N/A
Unsaturated / Saturated Fat ratio
3
0.57
N/A
Net carbs
4g
3.09g
N/A
Carbs
4g
3.09g
0%
Sugar
0g
0.48g
N/A
Vitamin B3
0.12mg
0.059mg
0%
Trans fat
0.917g
N/A
Tryptophan
0.323mg
0.547mg
0%
Threonine
1.263mg
1.044mg
0%
Isoleucine
1.035mg
1.206mg
0%
Leucine
2.133mg
1.939mg
0%
Lysine
1.834mg
1.025mg
0%
Methionine
0.646mg
0.547mg
0%
Phenylalanine
1.071mg
1.074mg
0%
Valine
1.263mg
1.404mg
0%
Histidine
0.649mg
0.547mg
0%
Omega-3 - EPA
2.741g
0.01g
N/A
Omega-3 - DHA
3.8g
0.001g
N/A
Omega-3 - DPA
0.229g
0.017g
N/A
Omega-6 - Eicosadienoic acid
0.007g
N/A
Macronutrient Comparison
Macronutrient breakdown side-by-side comparison
4
25%
18%
4%
48%
6%
Protein:
24.6 g
Fats:
17.9 g
Carbs:
4 g
Water:
47.5 g
Other:
6 g
1
23%
33%
3%
37%
4%
Protein:
22.87 g
Fats:
33.31 g
Carbs:
3.09 g
Water:
37.02 g
Other:
3.71 g
Contains
more
Carbs Carbs
+29.4%
Contains
more
Water Water
+28.3%
Contains
more
Other Other
+61.7%
Contains
more
Fats Fats
+86.1%
~equal in
Protein
~22.87g
Fat Type Comparison
Fat type breakdown side-by-side comparison
2
25%
29%
46%
Saturated fat:
Sat. Fat
4.06 g
Monounsaturated fat:
Mono. Fat
4.631 g
Polyunsaturated fat:
Poly. Fat
7.405 g
1
64%
31%
5%
Saturated fat:
Sat. Fat
18.867 g
Monounsaturated fat:
Mono. Fat
9.246 g
Polyunsaturated fat:
Poly. Fat
1.421 g
Contains
less
Sat. Fat Saturated fat
-78.5%
Contains
more
Poly. Fat Polyunsaturated fat
+421.1%
Contains
more
Mono. Fat Monounsaturated fat
+99.7%