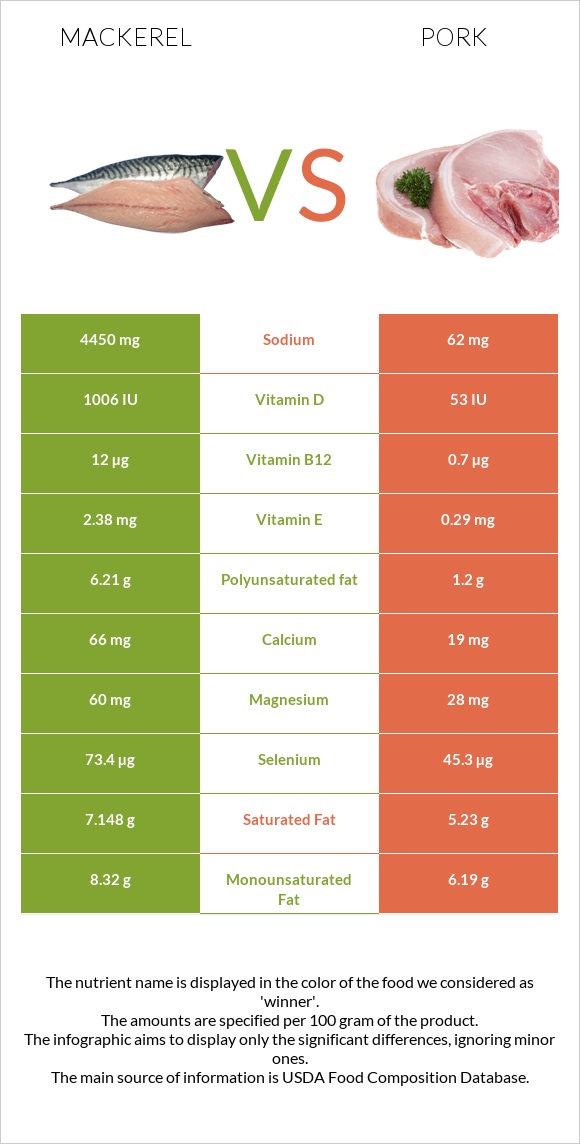
Important differences between mackerel and pork Mackerel has more vitamin B12, vitamin D*, selenium, and vitamin E; however, pork is richer in vitamin B1, zinc, vitamin B3, and vitamin B2. Mackerel's daily need coverage for vitamin B12 is 471% more. Mackerel contains 72 times more sodium than pork. Mackerel contains 4450mg of sodium, while pork contains 62mg. The food varieties used in the comparison are Fish, mackerel, salted and Pork, fresh, loin, whole, separable lean, and fat, cooked, broiled .
Infographic
Mineral Comparison
Mineral comparison score is based on the number of minerals by which one or the other food is richer. The "coverage" charts below show how much of the daily needs can be covered by 300 grams of the food.
6
100 g
300 g
1 cubic inch, boneless - 17g 1 piece (5-1/2" x 1-1/2" x 1/2") - 80g 1 cup, cooked - 136g
Magnesium
Magnesium
Calcium
Calcium
Potassium
Potassium
Iron
Iron
Copper
Copper
Zinc
Zinc
Phosphorus
Phosphorus
Sodium
Sodium
Manganese
Manganese
Selenium
Selenium
43%
20%
46%
53%
33%
30%
109%
580%
0%
400%
3
100 g
300 g
3 oz - 85g 1 chop, excluding refuse (yield from 1 raw chop, with refuse, weighing 151 g) - 87g
Magnesium
Magnesium
Calcium
Calcium
Potassium
Potassium
Iron
Iron
Copper
Copper
Zinc
Zinc
Phosphorus
Phosphorus
Sodium
Sodium
Manganese
Manganese
Selenium
Selenium
20%
5.7%
37%
33%
24%
65%
105%
8.1%
1.2%
247%
Vitamin Comparison
Vitamin comparison score is based on the number of vitamins by which one or the other food is richer. The "coverage" charts below show how much of the daily needs can be covered by 300 grams of the food.
6
100 g
300 g
1 cubic inch, boneless - 17g 1 piece (5-1/2" x 1-1/2" x 1/2") - 80g 1 cup, cooked - 136g
Vitamin C
Vit. C
Vitamin D
Vit. D
Vitamin A
Vit. A
Vitamin E
Vit. E
Vitamin B1
Vit. B1
Vitamin B2
Vit. B2
Vitamin B3
Vit. B3
Vitamin B5
Vit. B5
Vitamin B6
Vit. B6
Vitamin B12
Vit. B12
Vitamin K
Vit. K
Folate
Folate
0%
378%
16%
48%
5%
44%
62%
0%
95%
1500%
20%
11%
6
100 g
300 g
3 oz - 85g 1 chop, excluding refuse (yield from 1 raw chop, with refuse, weighing 151 g) - 87g
Vitamin C
Vit. C
Vitamin D
Vit. D
Vitamin A
Vit. A
Vitamin E
Vit. E
Vitamin B1
Vit. B1
Vitamin B2
Vit. B2
Vitamin B3
Vit. B3
Vitamin B5
Vit. B5
Vitamin B6
Vit. B6
Vitamin B12
Vit. B12
Vitamin K
Vit. K
Folate
Folate
2%
20%
0.67%
5.8%
219%
74%
94%
42%
107%
88%
0%
3.8%
All nutrients comparison - raw data values
Nutrient
DV% diff.
Vitamin B12
12µg
0.7µg
471%
Sodium
4450mg
62mg
191%
Vitamin D
25.2µg
1.3µg
120%
Vitamin D*
1006 IU
53 IU
119%
Vitamin B1
0.02mg
0.877mg
71%
Selenium
73.4µg
45.3µg
51%
Polyunsaturated fat
6.21g
1.2g
33%
Protein
18.5g
27.32g
18%
Fats
25.1g
13.92g
17%
Vitamin E
2.38mg
0.29mg
14%
Vitamin B5
0.698mg
14%
Zinc
1.1mg
2.39mg
12%
Vitamin B3
3.3mg
5.037mg
11%
Vitamin B2
0.19mg
0.321mg
10%
Saturated fat
7.148g
5.23g
9%
Magnesium
60mg
28mg
8%
Iron
1.4mg
0.87mg
7%
Vitamin K
7.8µg
0µg
7%
Cholesterol
95mg
80mg
5%
Calcium
66mg
19mg
5%
Vitamin A
47µg
2µg
5%
Monounsaturated fat
8.32g
6.19g
5%
Vitamin B6
0.41mg
0.464mg
4%
Calories
305kcal
242kcal
3%
Potassium
520mg
423mg
3%
Copper
0.1mg
0.073mg
3%
Folate
15µg
5µg
3%
Vitamin C
0mg
0.6mg
1%
Phosphorus
254mg
246mg
1%
Choline
101.6mg
93.9mg
1%
Protein per 100 calories
6.1g
11g
N/A
Calories per 10 g protein
165kcal
89kcal
N/A
Weight per 100 calories
33g
41g
N/A
Unsaturated / Saturated Fat ratio
2
1.4
N/A
Manganese
0.009mg
0%
Tryptophan
0.338mg
0%
Threonine
1.234mg
0%
Isoleucine
1.26mg
0%
Leucine
2.177mg
0%
Lysine
2.446mg
0%
Methionine
0.712mg
0%
Phenylalanine
1.086mg
0%
Valine
1.473mg
0%
Histidine
1.067mg
0%
Omega-3 - EPA
1.619g
0g
N/A
Omega-3 - DHA
2.965g
0g
N/A
Omega-3 - DPA
0.391g
0g
N/A
Macronutrient Comparison
Macronutrient breakdown side-by-side comparison
2
19%
25%
43%
13%
Protein:
18.5 g
Fats:
25.1 g
Carbs:
0 g
Water:
43 g
Other:
13.4 g
2
27%
14%
58%
Protein:
27.32 g
Fats:
13.92 g
Carbs:
0 g
Water:
57.87 g
Other:
0.89 g
Contains
more
Fats Fats
+80.3%
Contains
more
Other Other
+1405.6%
Contains
more
Protein Protein
+47.7%
Contains
more
Water Water
+34.6%
Fat Type Comparison
Fat type breakdown side-by-side comparison
2
33%
38%
29%
Saturated fat:
Sat. Fat
7.148 g
Monounsaturated fat:
Mono. Fat
8.32 g
Polyunsaturated fat:
Poly. Fat
6.21 g
1
41%
49%
10%
Saturated fat:
Sat. Fat
5.23 g
Monounsaturated fat:
Mono. Fat
6.19 g
Polyunsaturated fat:
Poly. Fat
1.2 g
Contains
more
Mono. Fat Monounsaturated fat
+34.4%
Contains
more
Poly. Fat Polyunsaturated fat
+417.5%
Contains
less
Sat. Fat Saturated fat
-26.8%