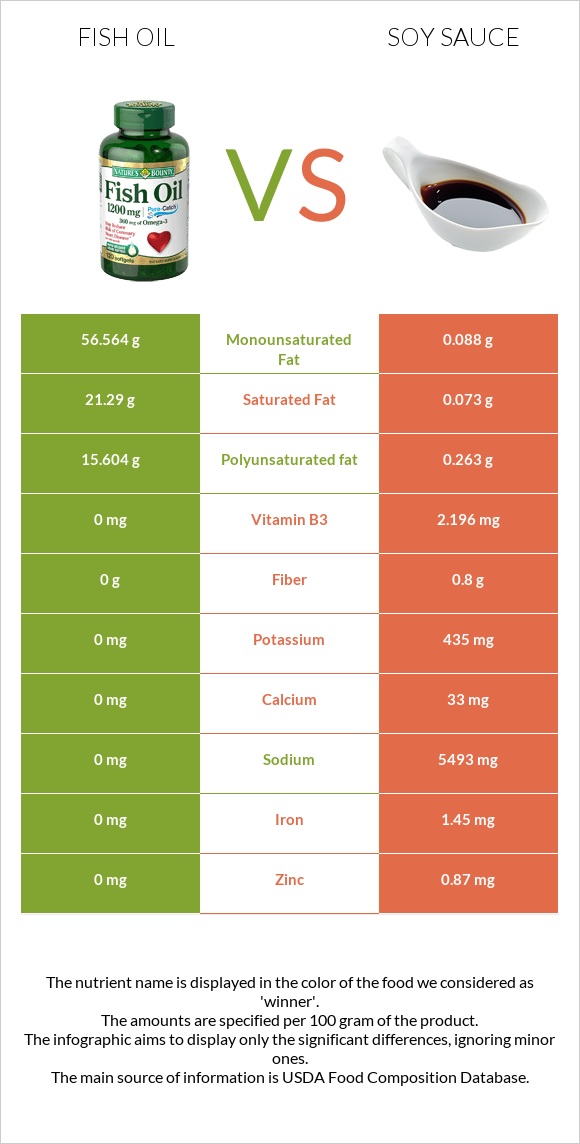
What are the differences between fish oil and soy sauce? Fish oil is higher in vitamin D*, yet soy sauce is higher in manganese, phosphorus, iron, magnesium, vitamin B3, and potassium. Soy sauce's daily need coverage for sodium is 239% more. The glycemic index of fish oil is lower. We used Fish oil, sardine and Soy sauce made from soy and wheat (shoyu) types in this article.
Infographic
Mineral Comparison
Mineral comparison score is based on the number of minerals by which one or the other food is richer. The "coverage" charts below show how much of the daily needs can be covered by 300 grams of the food.
1
100 g
300 g
1 tsp - 4.5g 1 tbsp - 13.6g 1 cup - 218g
Magnesium
Magnesium
Calcium
Calcium
Potassium
Potassium
Iron
Iron
Copper
Copper
Zinc
Zinc
Phosphorus
Phosphorus
Sodium
Sodium
Manganese
Manganese
Selenium
Selenium
0%
0%
0%
0%
0%
0%
0%
0%
0%
0%
9
100 g
300 g
1 tsp - 5.3g 1 individual packet - 8.9g 1 tbsp - 16g 1 cup - 255g
Magnesium
Magnesium
Calcium
Calcium
Potassium
Potassium
Iron
Iron
Copper
Copper
Zinc
Zinc
Phosphorus
Phosphorus
Sodium
Sodium
Manganese
Manganese
Selenium
Selenium
53%
9.9%
38%
54%
14%
24%
71%
716%
133%
2.7%
Vitamin Comparison
Vitamin comparison score is based on the number of vitamins by which one or the other food is richer. The "coverage" charts below show how much of the daily needs can be covered by 300 grams of the food.
1
100 g
300 g
1 tsp - 4.5g 1 tbsp - 13.6g 1 cup - 218g
Vitamin C
Vit. C
Vitamin D
Vit. D
Vitamin A
Vit. A
Vitamin E
Vit. E
Vitamin B1
Vit. B1
Vitamin B2
Vit. B2
Vitamin B3
Vit. B3
Vitamin B5
Vit. B5
Vitamin B6
Vit. B6
Vitamin B12
Vit. B12
Vitamin K
Vit. K
Folate
Folate
0%
125%
0%
0%
0%
0%
0%
0%
0%
0%
0%
0%
6
100 g
300 g
1 tsp - 5.3g 1 individual packet - 8.9g 1 tbsp - 16g 1 cup - 255g
Vitamin C
Vit. C
Vitamin D
Vit. D
Vitamin A
Vit. A
Vitamin E
Vit. E
Vitamin B1
Vit. B1
Vitamin B2
Vit. B2
Vitamin B3
Vit. B3
Vitamin B5
Vit. B5
Vitamin B6
Vit. B6
Vitamin B12
Vit. B12
Vitamin K
Vit. K
Folate
Folate
0%
0%
0%
0%
8.3%
38%
41%
18%
34%
0%
0%
11%
All nutrients comparison - raw data values
Nutrient
DV% diff.
Sodium
0mg
5493mg
239%
Cholesterol
710mg
0mg
237%
Polyunsaturated fat
31.867g
0.263g
211%
Fats
100g
0.57g
153%
Saturated fat
29.892g
0.073g
136%
Monounsaturated fat
33.841g
0.088g
84%
Manganese
0mg
1.018mg
44%
Calories
902kcal
53kcal
42%
Vitamin D*
332 IU
0 IU
42%
Vitamin D
8.3µg
0µg
42%
Phosphorus
0mg
166mg
24%
Magnesium
0mg
74mg
18%
Iron
0mg
1.45mg
18%
Protein
0g
8.14g
16%
Vitamin B3
0mg
2.196mg
14%
Potassium
0mg
435mg
13%
Vitamin B2
0mg
0.165mg
13%
Vitamin B6
0mg
0.148mg
11%
Zinc
0mg
0.87mg
8%
Vitamin B5
0mg
0.297mg
6%
Copper
0mg
0.043mg
5%
Folate
0µg
14µg
4%
Calcium
0mg
33mg
3%
Fiber
0g
0.8g
3%
Vitamin B1
0mg
0.033mg
3%
Choline
18.3mg
3%
Carbs
0g
4.93g
2%
Selenium
0µg
0.5µg
1%
Protein per 100 calories
0g
15g
N/A
Calories per 10 g protein
65kcal
N/A
Weight per 100 calories
11g
189g
N/A
Unsaturated / Saturated Fat ratio
2.2
4.8
N/A
Net carbs
0g
4.13g
N/A
Sugar
0.4g
N/A
Tryptophan
0.096mg
0%
Threonine
0.271mg
0%
Isoleucine
0.318mg
0%
Leucine
0.537mg
0%
Lysine
0.381mg
0%
Methionine
0.097mg
0%
Phenylalanine
0.353mg
0%
Valine
0.332mg
0%
Histidine
0.174mg
0%
Omega-3 - EPA
10.137g
0g
N/A
Omega-3 - DHA
10.656g
0g
N/A
Omega-3 - DPA
1.973g
0g
N/A
Macronutrient Comparison
Macronutrient breakdown side-by-side comparison
1
100%
Protein:
0 g
Fats:
100 g
Carbs:
0 g
Water:
0 g
Other:
0 g
4
8%
5%
71%
15%
Protein:
8.14 g
Fats:
0.57 g
Carbs:
4.93 g
Water:
71.15 g
Other:
15.21 g
Contains
more
Fats Fats
+17443.9%
Contains
more
Protein Protein
+∞%
Contains
more
Carbs Carbs
+∞%
Contains
more
Water Water
+∞%
Contains
more
Other Other
+∞%
Fat Type Comparison
Fat type breakdown side-by-side comparison
2
31%
35%
33%
Saturated fat:
Sat. Fat
29.892 g
Monounsaturated fat:
Mono. Fat
33.841 g
Polyunsaturated fat:
Poly. Fat
31.867 g
1
17%
21%
62%
Saturated fat:
Sat. Fat
0.073 g
Monounsaturated fat:
Mono. Fat
0.088 g
Polyunsaturated fat:
Poly. Fat
0.263 g
Contains
more
Mono. Fat Monounsaturated fat
+38355.7%
Contains
more
Poly. Fat Polyunsaturated fat
+12016.7%
Contains
less
Sat. Fat Saturated fat
-99.8%