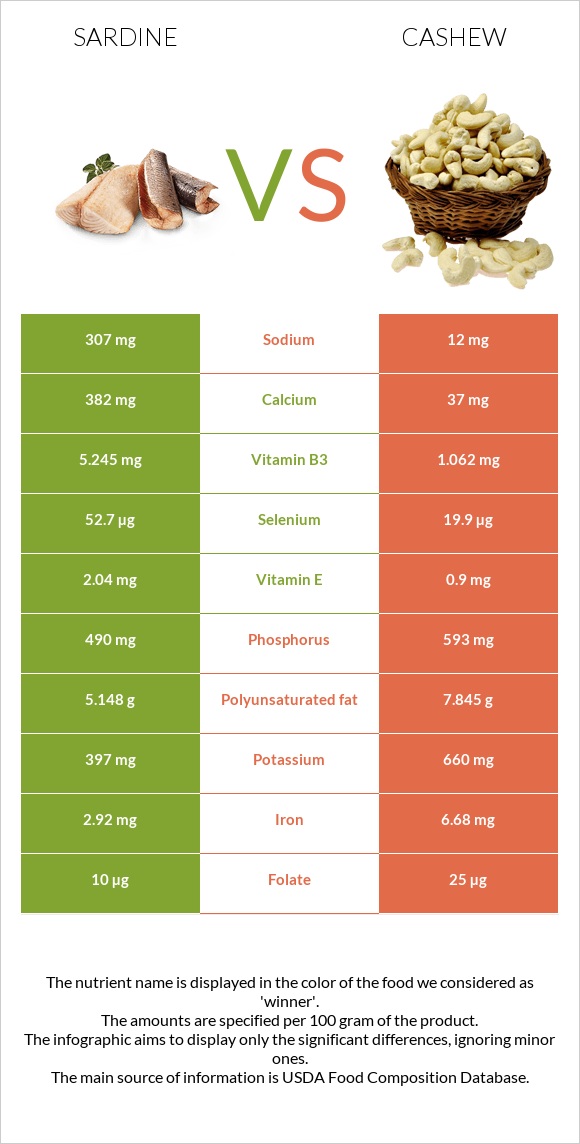
A recap on the differences between sardines and cashew Sardines are higher in vitamin B12, selenium, and calcium, yet cashew is higher in copper, manganese, magnesium, iron, and zinc. Sardines cover your daily vitamin B12 needs 373% more than cashew. The glycemic index of sardines is lower. Food varieties used in this article are Fish, sardine, Atlantic, canned in oil, drained solids with bone and Nuts, cashew nuts, raw .
Infographic
Mineral Comparison
Mineral comparison score is based on the number of minerals by which one or the other food is richer. The "coverage" charts below show how much of the daily needs can be covered by 300 grams of the food.
2
100 g
300 g
1 small (2-2/3" x 1/2" x 1/4") - 12g 1 cubic inch - 16g 2 sardines - 24g 1 oz - 28.35g 1 can (3.75 oz) - 92g 1 cup, drained - 149g
Magnesium
Magnesium
Calcium
Calcium
Potassium
Potassium
Iron
Iron
Copper
Copper
Zinc
Zinc
Phosphorus
Phosphorus
Sodium
Sodium
Manganese
Manganese
Selenium
Selenium
28%
115%
35%
110%
62%
36%
210%
40%
14%
287%
8
100 g
300 g
1 oz - 28.35g
Magnesium
Magnesium
Calcium
Calcium
Potassium
Potassium
Iron
Iron
Copper
Copper
Zinc
Zinc
Phosphorus
Phosphorus
Sodium
Sodium
Manganese
Manganese
Selenium
Selenium
209%
11%
58%
251%
732%
158%
254%
1.6%
216%
109%
Vitamin Comparison
Vitamin comparison score is based on the number of vitamins by which one or the other food is richer. The "coverage" charts below show how much of the daily needs can be covered by 300 grams of the food.
6
100 g
300 g
1 small (2-2/3" x 1/2" x 1/4") - 12g 1 cubic inch - 16g 2 sardines - 24g 1 oz - 28.35g 1 can (3.75 oz) - 92g 1 cup, drained - 149g
Vitamin C
Vit. C
Vitamin D
Vit. D
Vitamin A
Vit. A
Vitamin E
Vit. E
Vitamin B1
Vit. B1
Vitamin B2
Vit. B2
Vitamin B3
Vit. B3
Vitamin B5
Vit. B5
Vitamin B6
Vit. B6
Vitamin B12
Vit. B12
Vitamin K
Vit. K
Folate
Folate
0%
72%
11%
41%
20%
52%
98%
39%
39%
1118%
6.5%
7.5%
6
100 g
300 g
1 oz - 28.35g
Vitamin C
Vit. C
Vitamin D
Vit. D
Vitamin A
Vit. A
Vitamin E
Vit. E
Vitamin B1
Vit. B1
Vitamin B2
Vit. B2
Vitamin B3
Vit. B3
Vitamin B5
Vit. B5
Vitamin B6
Vit. B6
Vitamin B12
Vit. B12
Vitamin K
Vit. K
Folate
Folate
1.7%
0%
0%
18%
106%
13%
20%
52%
96%
0%
85%
19%
All nutrients comparison - raw data values
Nutrient
DV% diff.
Vitamin B12
8.94µg
0µg
373%
Copper
0.186mg
2.195mg
223%
Manganese
0.108mg
1.655mg
67%
Magnesium
39mg
292mg
60%
Selenium
52.7µg
19.9µg
60%
Fats
11.45g
43.85g
50%
Monounsaturated fat
3.869g
23.797g
50%
Cholesterol
142mg
0mg
47%
Iron
2.92mg
6.68mg
47%
Zinc
1.31mg
5.78mg
41%
Calcium
382mg
37mg
35%
Vitamin B1
0.08mg
0.423mg
29%
Saturated fat
1.528g
7.783g
28%
Vitamin B3
5.245mg
1.062mg
26%
Vitamin K
2.6µg
34.1µg
26%
Vitamin D*
193 IU
0 IU
24%
Vitamin D
4.8µg
0µg
24%
Vitamin B6
0.167mg
0.417mg
19%
Polyunsaturated fat
5.148g
7.845g
18%
Calories
208kcal
553kcal
17%
Phosphorus
490mg
593mg
15%
Choline
75mg
14%
Protein
24.62g
18.22g
13%
Fiber
0g
3.3g
13%
Sodium
307mg
12mg
13%
Vitamin B2
0.227mg
0.058mg
13%
Carbs
0g
30.19g
10%
Starch
23.49g
10%
Potassium
397mg
660mg
8%
Vitamin E
2.04mg
0.9mg
8%
Vitamin A
32µg
0µg
4%
Vitamin B5
0.642mg
0.864mg
4%
Folate
10µg
25µg
4%
Vitamin C
0mg
0.5mg
1%
Protein per 100 calories
12g
3.3g
N/A
Calories per 10 g protein
84kcal
304kcal
N/A
Weight per 100 calories
48g
18g
N/A
Unsaturated / Saturated Fat ratio
5.9
4.1
N/A
Net carbs
0g
26.89g
N/A
Sugar
0g
5.91g
N/A
Tryptophan
0.276mg
0.287mg
0%
Threonine
1.079mg
0.688mg
0%
Isoleucine
1.134mg
0.789mg
0%
Leucine
2.001mg
1.472mg
0%
Lysine
2.26mg
0.928mg
0%
Methionine
0.729mg
0.362mg
0%
Phenylalanine
0.961mg
0.951mg
0%
Valine
1.268mg
1.094mg
0%
Histidine
0.725mg
0.456mg
0%
Fructose
0.05g
0%
Omega-3 - EPA
0.473g
0g
N/A
Omega-3 - DHA
0.509g
0g
N/A
Macronutrient Comparison
Macronutrient breakdown side-by-side comparison
3
25%
11%
60%
4%
Protein:
24.62 g
Fats:
11.45 g
Carbs:
0 g
Water:
59.61 g
Other:
4.32 g
2
18%
44%
30%
5%
3%
Protein:
18.22 g
Fats:
43.85 g
Carbs:
30.19 g
Water:
5.2 g
Other:
2.54 g
Contains
more
Protein Protein
+35.1%
Contains
more
Water Water
+1046.3%
Contains
more
Other Other
+70.1%
Contains
more
Fats Fats
+283%
Contains
more
Carbs Carbs
+∞%
Fat Type Comparison
Fat type breakdown side-by-side comparison
1
14%
37%
49%
Saturated fat:
Sat. Fat
1.528 g
Monounsaturated fat:
Mono. Fat
3.869 g
Polyunsaturated fat:
Poly. Fat
5.148 g
2
20%
60%
20%
Saturated fat:
Sat. Fat
7.783 g
Monounsaturated fat:
Mono. Fat
23.797 g
Polyunsaturated fat:
Poly. Fat
7.845 g
Contains
less
Sat. Fat Saturated fat
-80.4%
Contains
more
Mono. Fat Monounsaturated fat
+515.1%
Contains
more
Poly. Fat Polyunsaturated fat
+52.4%