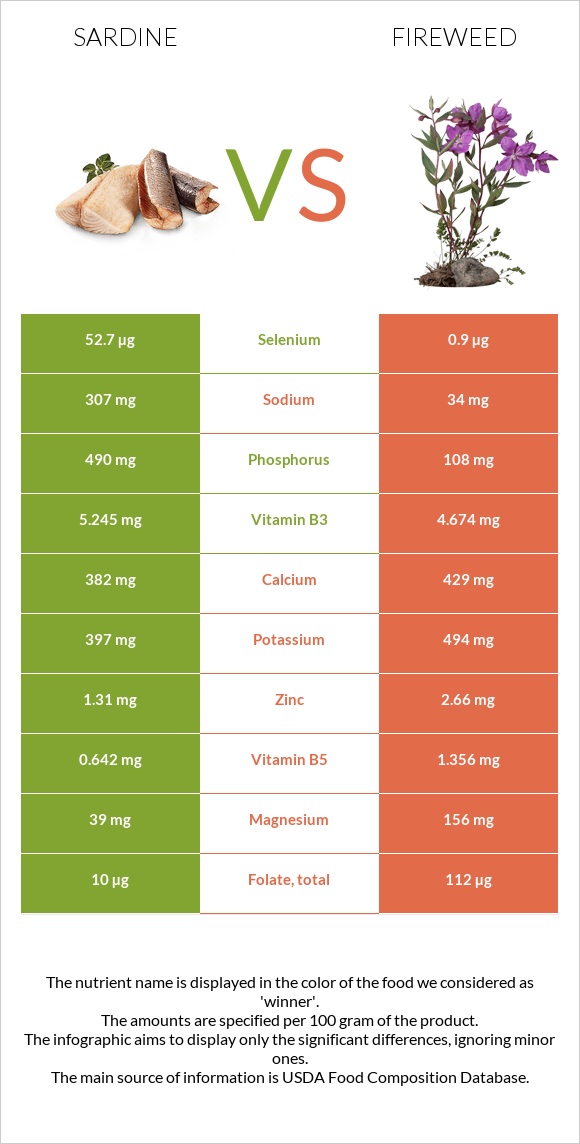
Summary of differences between sardines and fireweed Sardines have more vitamin B12, selenium, and phosphorus; however, fireweed is higher in manganese, vitamin A, fiber, vitamin B6, magnesium, and folate. Sardines cover your daily need for vitamin B12, 373% more than fireweed. These are the specific foods used in this comparison Fish, sardine, Atlantic, canned in oil, drained solids with bone and Fireweed, leaves, raw .
Infographic
Mineral Comparison
Mineral comparison score is based on the number of minerals by which one or the other food is richer. The "coverage" charts below show how much of the daily needs can be covered by 300 grams of the food.
3
100 g
300 g
1 small (2-2/3" x 1/2" x 1/4") - 12g 1 cubic inch - 16g 2 sardines - 24g 1 oz - 28.35g 1 can (3.75 oz) - 92g 1 cup, drained - 149g
Magnesium
Magnesium
Calcium
Calcium
Potassium
Potassium
Iron
Iron
Copper
Copper
Zinc
Zinc
Phosphorus
Phosphorus
Sodium
Sodium
Manganese
Manganese
Selenium
Selenium
28%
115%
35%
110%
62%
36%
210%
40%
14%
287%
7
100 g
300 g
1 plant - 22g 1 cup, chopped - 23g
Magnesium
Magnesium
Calcium
Calcium
Potassium
Potassium
Iron
Iron
Copper
Copper
Zinc
Zinc
Phosphorus
Phosphorus
Sodium
Sodium
Manganese
Manganese
Selenium
Selenium
111%
129%
44%
90%
107%
73%
46%
4.4%
874%
4.9%
Vitamin Comparison
Vitamin comparison score is based on the number of vitamins by which one or the other food is richer. The "coverage" charts below show how much of the daily needs can be covered by 300 grams of the food.
7
100 g
300 g
1 small (2-2/3" x 1/2" x 1/4") - 12g 1 cubic inch - 16g 2 sardines - 24g 1 oz - 28.35g 1 can (3.75 oz) - 92g 1 cup, drained - 149g
Vitamin C
Vit. C
Vitamin D
Vit. D
Vitamin A
Vit. A
Vitamin E
Vit. E
Vitamin B1
Vit. B1
Vitamin B2
Vit. B2
Vitamin B3
Vit. B3
Vitamin B5
Vit. B5
Vitamin B6
Vit. B6
Vitamin B12
Vit. B12
Vitamin K
Vit. K
Folate
Folate
0%
72%
11%
41%
20%
52%
98%
39%
39%
1118%
6.5%
7.5%
5
100 g
300 g
1 plant - 22g 1 cup, chopped - 23g
Vitamin C
Vit. C
Vitamin D
Vit. D
Vitamin A
Vit. A
Vitamin E
Vit. E
Vitamin B1
Vit. B1
Vitamin B2
Vit. B2
Vitamin B3
Vit. B3
Vitamin B5
Vit. B5
Vitamin B6
Vit. B6
Vitamin B12
Vit. B12
Vitamin K
Vit. K
Folate
Folate
7.3%
0%
60%
0%
8.3%
32%
88%
81%
146%
0%
0%
84%
All nutrients comparison - raw data values
Nutrient
DV% diff.
Vitamin B12
8.94µg
0µg
373%
Manganese
0.108mg
6.704mg
287%
Selenium
52.7µg
0.9µg
94%
Phosphorus
490mg
108mg
55%
Cholesterol
142mg
0mg
47%
Fiber
0g
10.6g
42%
Protein
24.62g
4.71g
40%
Vitamin B6
0.167mg
0.632mg
36%
Polyunsaturated fat
5.148g
34%
Magnesium
39mg
156mg
28%
Folate
10µg
112µg
26%
Vitamin D*
193 IU
0 IU
24%
Vitamin D
4.8µg
0µg
24%
Vitamin A
32µg
180µg
16%
Copper
0.186mg
0.32mg
15%
Vitamin E
2.04mg
14%
Vitamin B5
0.642mg
1.356mg
14%
Choline
75mg
14%
Fats
11.45g
2.75g
13%
Zinc
1.31mg
2.66mg
12%
Sodium
307mg
34mg
12%
Monounsaturated fat
3.869g
10%
Iron
2.92mg
2.4mg
7%
Vitamin B2
0.227mg
0.137mg
7%
Saturated fat
1.528g
7%
Carbs
0g
19.22g
6%
Calories
208kcal
103kcal
5%
Calcium
382mg
429mg
5%
Vitamin B1
0.08mg
0.033mg
4%
Vitamin B3
5.245mg
4.674mg
4%
Potassium
397mg
494mg
3%
Vitamin C
0mg
2.2mg
2%
Vitamin K
2.6µg
2%
Protein per 100 calories
12g
4.6g
N/A
Calories per 10 g protein
84kcal
219kcal
N/A
Weight per 100 calories
48g
97g
N/A
Unsaturated / Saturated Fat ratio
5.9
N/A
Net carbs
0g
8.62g
N/A
Tryptophan
0.276mg
0%
Threonine
1.079mg
0%
Isoleucine
1.134mg
0%
Leucine
2.001mg
0%
Lysine
2.26mg
0%
Methionine
0.729mg
0%
Phenylalanine
0.961mg
0%
Valine
1.268mg
0%
Histidine
0.725mg
0%
Omega-3 - EPA
0.473g
N/A
Omega-3 - DHA
0.509g
N/A
Macronutrient Comparison
Macronutrient breakdown side-by-side comparison
3
25%
11%
60%
4%
Protein:
24.62 g
Fats:
11.45 g
Carbs:
0 g
Water:
59.61 g
Other:
4.32 g
2
5%
3%
19%
71%
3%
Protein:
4.71 g
Fats:
2.75 g
Carbs:
19.22 g
Water:
70.78 g
Other:
2.54 g
Contains
more
Protein Protein
+422.7%
Contains
more
Fats Fats
+316.4%
Contains
more
Other Other
+70.1%
Contains
more
Carbs Carbs
+∞%
Contains
more
Water Water
+18.7%