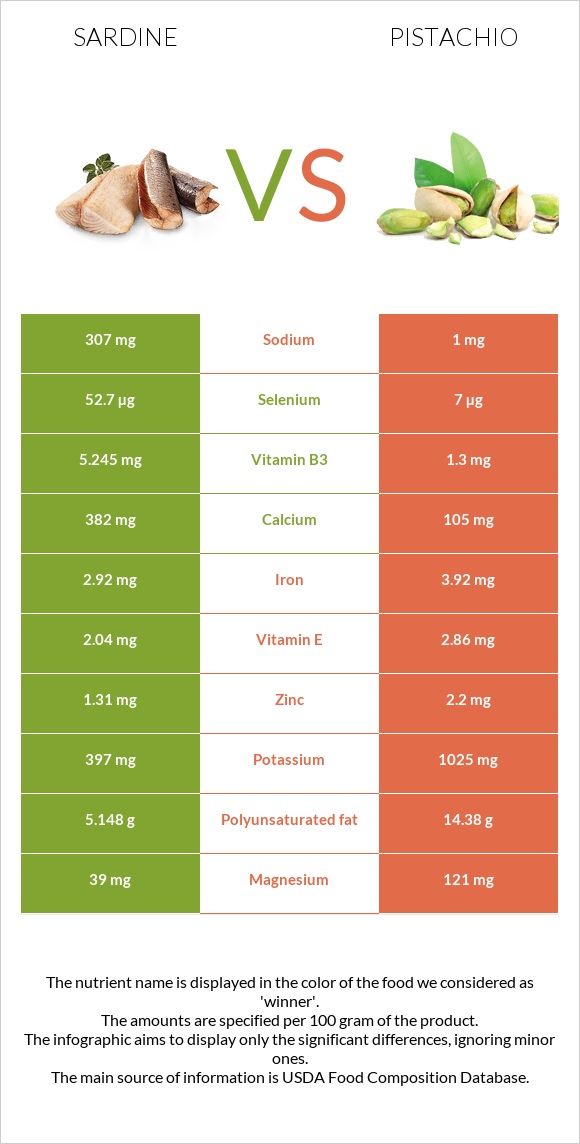
How are sardines and pistachios different? Sardines are higher in vitamin B12, selenium, calcium, and vitamin B3; however, pistachios are richer in copper, vitamin B6, vitamin B1, manganese, and fiber. Daily need coverage for vitamin B12 for sardines is 373% higher. Sardines have a lower glycemic index (0) than pistachios (28). Fish, sardine, Atlantic, canned in oil, drained solids with bone and Nuts, pistachio nuts, raw are the varieties used in this article.
Infographic
Mineral Comparison
Mineral comparison score is based on the number of minerals by which one or the other food is richer. The "coverage" charts below show how much of the daily needs can be covered by 300 grams of the food.
2
100 g
300 g
1 small (2-2/3" x 1/2" x 1/4") - 12g 1 cubic inch - 16g 2 sardines - 24g 1 oz - 28.35g 1 can (3.75 oz) - 92g 1 cup, drained - 149g
Magnesium
Magnesium
Calcium
Calcium
Potassium
Potassium
Iron
Iron
Copper
Copper
Zinc
Zinc
Phosphorus
Phosphorus
Sodium
Sodium
Manganese
Manganese
Selenium
Selenium
28%
115%
35%
110%
62%
36%
210%
40%
14%
287%
7
100 g
300 g
1 kernel - 0.7g 1 oz (49 kernels) - 28.35g 1 cup - 123g
Magnesium
Magnesium
Calcium
Calcium
Potassium
Potassium
Iron
Iron
Copper
Copper
Zinc
Zinc
Phosphorus
Phosphorus
Sodium
Sodium
Manganese
Manganese
Selenium
Selenium
86%
32%
90%
147%
433%
60%
210%
0.13%
157%
38%
Vitamin Comparison
Vitamin comparison score is based on the number of vitamins by which one or the other food is richer. The "coverage" charts below show how much of the daily needs can be covered by 300 grams of the food.
7
100 g
300 g
1 small (2-2/3" x 1/2" x 1/4") - 12g 1 cubic inch - 16g 2 sardines - 24g 1 oz - 28.35g 1 can (3.75 oz) - 92g 1 cup, drained - 149g
Vitamin C
Vit. C
Vitamin D
Vit. D
Vitamin A
Vit. A
Vitamin E
Vit. E
Vitamin B1
Vit. B1
Vitamin B2
Vit. B2
Vitamin B3
Vit. B3
Vitamin B5
Vit. B5
Vitamin B6
Vit. B6
Vitamin B12
Vit. B12
Vitamin K
Vit. K
Folate
Folate
0%
72%
11%
41%
20%
52%
98%
39%
39%
1118%
6.5%
7.5%
5
100 g
300 g
1 kernel - 0.7g 1 oz (49 kernels) - 28.35g 1 cup - 123g
Vitamin C
Vit. C
Vitamin D
Vit. D
Vitamin A
Vit. A
Vitamin E
Vit. E
Vitamin B1
Vit. B1
Vitamin B2
Vit. B2
Vitamin B3
Vit. B3
Vitamin B5
Vit. B5
Vitamin B6
Vit. B6
Vitamin B12
Vit. B12
Vitamin K
Vit. K
Folate
Folate
19%
0%
8.7%
57%
218%
37%
24%
31%
392%
0%
0%
38%
All nutrients comparison - raw data values
Nutrient
DV% diff.
Vitamin B12
8.94µg
0µg
373%
Copper
0.186mg
1.3mg
124%
Vitamin B6
0.167mg
1.7mg
118%
Selenium
52.7µg
7µg
83%
Vitamin B1
0.08mg
0.87mg
66%
Polyunsaturated fat
5.148g
14.38g
62%
Fats
11.45g
45.32g
52%
Monounsaturated fat
3.869g
23.257g
48%
Cholesterol
142mg
0mg
47%
Manganese
0.108mg
1.2mg
47%
Fiber
0g
10.6g
42%
Calcium
382mg
105mg
28%
Vitamin B3
5.245mg
1.3mg
25%
Vitamin D*
193 IU
0 IU
24%
Vitamin D
4.8µg
0µg
24%
Magnesium
39mg
121mg
20%
Saturated fat
1.528g
5.907g
20%
Calories
208kcal
560kcal
18%
Potassium
397mg
1025mg
18%
Choline
75mg
14%
Iron
2.92mg
3.92mg
13%
Sodium
307mg
1mg
13%
Folate
10µg
51µg
10%
Protein
24.62g
20.16g
9%
Carbs
0g
27.17g
9%
Zinc
1.31mg
2.2mg
8%
Vitamin C
0mg
5.6mg
6%
Vitamin E
2.04mg
2.86mg
5%
Vitamin B2
0.227mg
0.16mg
5%
Vitamin B5
0.642mg
0.52mg
2%
Vitamin K
2.6µg
2%
Starch
1.67g
1%
Vitamin A
32µg
26µg
1%
Protein per 100 calories
12g
3.6g
N/A
Calories per 10 g protein
84kcal
278kcal
N/A
Weight per 100 calories
48g
18g
N/A
Unsaturated / Saturated Fat ratio
5.9
6.4
N/A
Net carbs
0g
16.57g
N/A
Sugar
0g
7.66g
N/A
Phosphorus
490mg
490mg
0%
Tryptophan
0.276mg
0.251mg
0%
Threonine
1.079mg
0.684mg
0%
Isoleucine
1.134mg
0.917mg
0%
Leucine
2.001mg
1.604mg
0%
Lysine
2.26mg
1.138mg
0%
Methionine
0.729mg
0.36mg
0%
Phenylalanine
0.961mg
1.092mg
0%
Valine
1.268mg
1.249mg
0%
Histidine
0.725mg
0.512mg
0%
Fructose
0.24g
0%
Omega-3 - EPA
0.473g
0g
N/A
Omega-3 - DHA
0.509g
0g
N/A
Omega-6 - Linoleic acid
14.091g
N/A
Macronutrient Comparison
Macronutrient breakdown side-by-side comparison
3
25%
11%
60%
4%
Protein:
24.62 g
Fats:
11.45 g
Carbs:
0 g
Water:
59.61 g
Other:
4.32 g
2
20%
45%
27%
4%
3%
Protein:
20.16 g
Fats:
45.32 g
Carbs:
27.17 g
Water:
4.37 g
Other:
2.98 g
Contains
more
Protein Protein
+22.1%
Contains
more
Water Water
+1264.1%
Contains
more
Other Other
+45%
Contains
more
Fats Fats
+295.8%
Contains
more
Carbs Carbs
+∞%
Fat Type Comparison
Fat type breakdown side-by-side comparison
1
14%
37%
49%
Saturated fat:
Sat. Fat
1.528 g
Monounsaturated fat:
Mono. Fat
3.869 g
Polyunsaturated fat:
Poly. Fat
5.148 g
2
14%
53%
33%
Saturated fat:
Sat. Fat
5.907 g
Monounsaturated fat:
Mono. Fat
23.257 g
Polyunsaturated fat:
Poly. Fat
14.38 g
Contains
less
Sat. Fat Saturated fat
-74.1%
Contains
more
Mono. Fat Monounsaturated fat
+501.1%
Contains
more
Poly. Fat Polyunsaturated fat
+179.3%