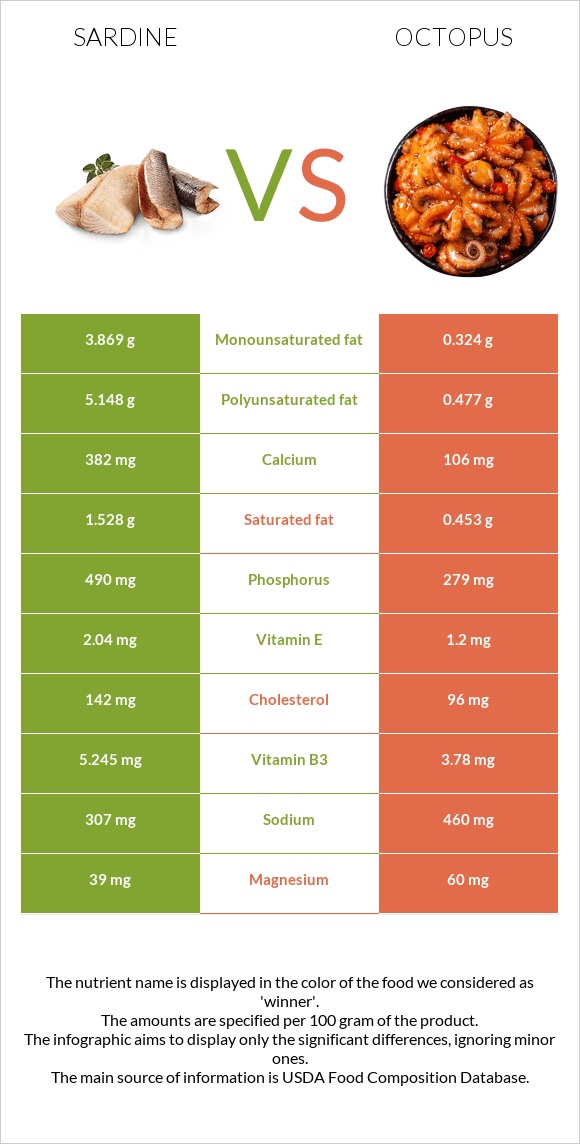
How are sardines and octopus different? Sardines are richer in phosphorus, calcium, and vitamin D*, while octopus is higher in vitamin B12, iron, selenium, copper, vitamin B6, and zinc. Octopus covers your daily need for vitamin B12, 1128% more than sardines. Octopus is lower in cholesterol. Fish, sardine, Atlantic, canned in oil, drained solids with bone and Mollusks, octopus, common, cooked, moist heat types were used in this article.
Infographic
Mineral Comparison
Mineral comparison score is based on the number of minerals by which one or the other food is richer. The "coverage" charts below show how much of the daily needs can be covered by 300 grams of the food.
4
100 g
300 g
1 small (2-2/3" x 1/2" x 1/4") - 12g 1 cubic inch - 16g 2 sardines - 24g 1 oz - 28.35g 1 can (3.75 oz) - 92g 1 cup, drained - 149g
Magnesium
Magnesium
Calcium
Calcium
Potassium
Potassium
Iron
Iron
Copper
Copper
Zinc
Zinc
Phosphorus
Phosphorus
Sodium
Sodium
Manganese
Manganese
Selenium
Selenium
28%
115%
35%
110%
62%
36%
210%
40%
14%
287%
6
100 g
300 g
3 oz - 85g
Magnesium
Magnesium
Calcium
Calcium
Potassium
Potassium
Iron
Iron
Copper
Copper
Zinc
Zinc
Phosphorus
Phosphorus
Sodium
Sodium
Manganese
Manganese
Selenium
Selenium
43%
32%
56%
358%
246%
92%
120%
60%
6.1%
489%
Vitamin Comparison
Vitamin comparison score is based on the number of vitamins by which one or the other food is richer. The "coverage" charts below show how much of the daily needs can be covered by 300 grams of the food.
6
100 g
300 g
1 small (2-2/3" x 1/2" x 1/4") - 12g 1 cubic inch - 16g 2 sardines - 24g 1 oz - 28.35g 1 can (3.75 oz) - 92g 1 cup, drained - 149g
Vitamin C
Vit. C
Vitamin D
Vit. D
Vitamin A
Vit. A
Vitamin E
Vit. E
Vitamin B1
Vit. B1
Vitamin B2
Vit. B2
Vitamin B3
Vit. B3
Vitamin B5
Vit. B5
Vitamin B6
Vit. B6
Vitamin B12
Vit. B12
Vitamin K
Vit. K
Folate
Folate
0%
72%
11%
41%
20%
52%
98%
39%
39%
1118%
6.5%
7.5%
6
100 g
300 g
3 oz - 85g
Vitamin C
Vit. C
Vitamin D
Vit. D
Vitamin A
Vit. A
Vitamin E
Vit. E
Vitamin B1
Vit. B1
Vitamin B2
Vit. B2
Vitamin B3
Vit. B3
Vitamin B5
Vit. B5
Vitamin B6
Vit. B6
Vitamin B12
Vit. B12
Vitamin K
Vit. K
Folate
Folate
27%
0%
30%
24%
14%
18%
71%
54%
150%
4500%
0.25%
18%
All nutrients comparison - raw data values
Nutrient
DV% diff.
Vitamin B12
8.94µg
36µg
1128%
Iron
2.92mg
9.54mg
83%
Selenium
52.7µg
89.6µg
67%
Copper
0.186mg
0.739mg
61%
Vitamin B6
0.167mg
0.648mg
37%
Polyunsaturated fat
5.148g
0.477g
31%
Phosphorus
490mg
279mg
30%
Calcium
382mg
106mg
28%
Vitamin D*
193 IU
0 IU
24%
Vitamin D
4.8µg
0µg
24%
Zinc
1.31mg
3.36mg
19%
Cholesterol
142mg
96mg
15%
Fats
11.45g
2.08g
14%
Vitamin B2
0.227mg
0.076mg
12%
Protein
24.62g
29.82g
10%
Vitamin C
0mg
8mg
9%
Vitamin B3
5.245mg
3.78mg
9%
Monounsaturated fat
3.869g
0.324g
9%
Potassium
397mg
630mg
7%
Sodium
307mg
460mg
7%
Vitamin A
32µg
90µg
6%
Vitamin E
2.04mg
1.2mg
6%
Magnesium
39mg
60mg
5%
Vitamin B5
0.642mg
0.9mg
5%
Saturated fat
1.528g
0.453g
5%
Folate
10µg
24µg
4%
Manganese
0.108mg
0.047mg
3%
Calories
208kcal
164kcal
2%
Vitamin B1
0.08mg
0.057mg
2%
Vitamin K
2.6µg
0.1µg
2%
Carbs
0g
4.4g
1%
Choline
75mg
81mg
1%
Protein per 100 calories
12g
18g
N/A
Calories per 10 g protein
84kcal
55kcal
N/A
Weight per 100 calories
48g
61g
N/A
Unsaturated / Saturated Fat ratio
5.9
1.8
N/A
Net carbs
0g
4.4g
N/A
Tryptophan
0.276mg
0.334mg
0%
Threonine
1.079mg
1.283mg
0%
Isoleucine
1.134mg
1.298mg
0%
Leucine
2.001mg
2.099mg
0%
Lysine
2.26mg
2.228mg
0%
Methionine
0.729mg
0.673mg
0%
Phenylalanine
0.961mg
1.069mg
0%
Valine
1.268mg
1.303mg
0%
Histidine
0.725mg
0.573mg
0%
Omega-3 - EPA
0.473g
0.152g
N/A
Omega-3 - DHA
0.509g
0.162g
N/A
Omega-3 - DPA
0g
0.012g
N/A
Macronutrient Comparison
Macronutrient breakdown side-by-side comparison
2
25%
11%
60%
4%
Protein:
24.62 g
Fats:
11.45 g
Carbs:
0 g
Water:
59.61 g
Other:
4.32 g
3
30%
2%
4%
61%
3%
Protein:
29.82 g
Fats:
2.08 g
Carbs:
4.4 g
Water:
60.5 g
Other:
3.2 g
Contains
more
Fats Fats
+450.5%
Contains
more
Other Other
+35%
Contains
more
Protein Protein
+21.1%
Contains
more
Carbs Carbs
+∞%
Fat Type Comparison
Fat type breakdown side-by-side comparison
2
14%
37%
49%
Saturated fat:
Sat. Fat
1.528 g
Monounsaturated fat:
Mono. Fat
3.869 g
Polyunsaturated fat:
Poly. Fat
5.148 g
1
36%
26%
38%
Saturated fat:
Sat. Fat
0.453 g
Monounsaturated fat:
Mono. Fat
0.324 g
Polyunsaturated fat:
Poly. Fat
0.477 g
Contains
more
Mono. Fat Monounsaturated fat
+1094.1%
Contains
more
Poly. Fat Polyunsaturated fat
+979.2%
Contains
less
Sat. Fat Saturated fat
-70.4%