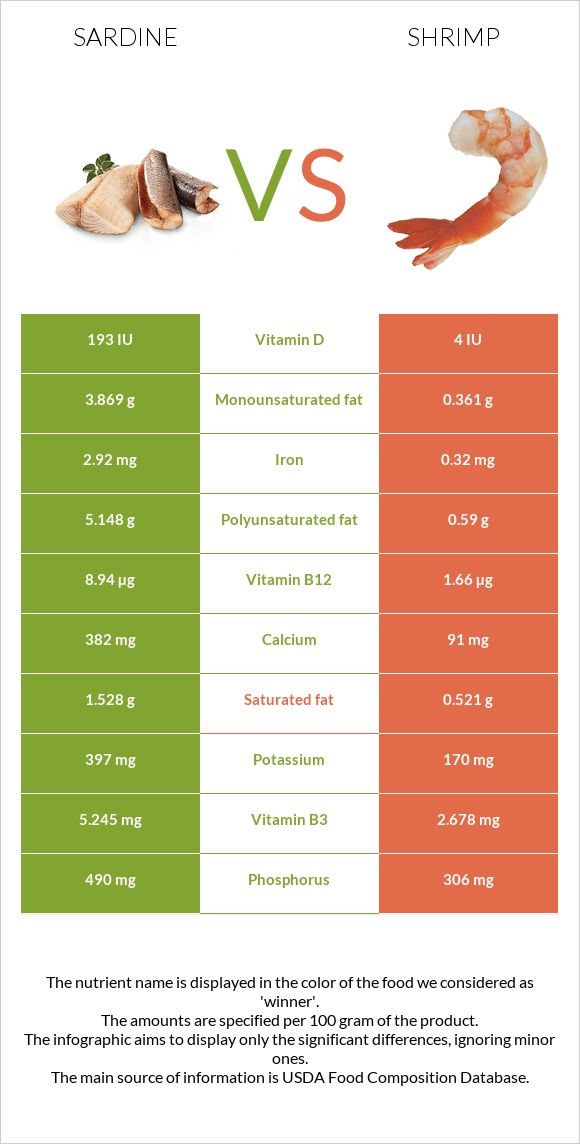
How are sardines and shrimp different? Sardines are higher in vitamin B12, iron, calcium, phosphorus, vitamin D*, vitamin B3, and vitamin B2; however, shrimp is richer in choline. Daily need coverage for vitamin B12 for sardines is 303% higher. Sardines contain 48 times more vitamin D* than shrimp. While sardines contain 193 IU of vitamin D*, shrimp contains only 4 IU. Sardines have less cholesterol. Sardines have a lower glycemic index (0) than shrimp (50). Fish, sardine, Atlantic, canned in oil, drained solids with bone and Crustaceans, shrimp, mixed species, cooked, moist heat (may have been previously frozen) are the varieties used in this article.
Infographic
Mineral Comparison
Mineral comparison score is based on the number of minerals by which one or the other food is richer. The "coverage" charts below show how much of the daily needs can be covered by 300 grams of the food.
6
100 g
300 g
1 small (2-2/3" x 1/2" x 1/4") - 12g 1 cubic inch - 16g 2 sardines - 24g 1 oz - 28.35g 1 can (3.75 oz) - 92g 1 cup, drained - 149g
Magnesium
Magnesium
Calcium
Calcium
Potassium
Potassium
Iron
Iron
Copper
Copper
Zinc
Zinc
Phosphorus
Phosphorus
Sodium
Sodium
Manganese
Manganese
Selenium
Selenium
28%
115%
35%
110%
62%
36%
210%
40%
14%
287%
2
100 g
300 g
4 large - 22g 3 oz - 85g
Magnesium
Magnesium
Calcium
Calcium
Potassium
Potassium
Iron
Iron
Copper
Copper
Zinc
Zinc
Phosphorus
Phosphorus
Sodium
Sodium
Manganese
Manganese
Selenium
Selenium
26%
27%
15%
12%
86%
44%
131%
124%
6.4%
270%
Vitamin Comparison
Vitamin comparison score is based on the number of vitamins by which one or the other food is richer. The "coverage" charts below show how much of the daily needs can be covered by 300 grams of the food.
7
100 g
300 g
1 small (2-2/3" x 1/2" x 1/4") - 12g 1 cubic inch - 16g 2 sardines - 24g 1 oz - 28.35g 1 can (3.75 oz) - 92g 1 cup, drained - 149g
Vitamin C
Vit. C
Vitamin D
Vit. D
Vitamin A
Vit. A
Vitamin E
Vit. E
Vitamin B1
Vit. B1
Vitamin B2
Vit. B2
Vitamin B3
Vit. B3
Vitamin B5
Vit. B5
Vitamin B6
Vit. B6
Vitamin B12
Vit. B12
Vitamin K
Vit. K
Folate
Folate
0%
72%
11%
41%
20%
52%
98%
39%
39%
1118%
6.5%
7.5%
3
100 g
300 g
4 large - 22g 3 oz - 85g
Vitamin C
Vit. C
Vitamin D
Vit. D
Vitamin A
Vit. A
Vitamin E
Vit. E
Vitamin B1
Vit. B1
Vitamin B2
Vit. B2
Vitamin B3
Vit. B3
Vitamin B5
Vit. B5
Vitamin B6
Vit. B6
Vitamin B12
Vit. B12
Vitamin K
Vit. K
Folate
Folate
0%
1.5%
30%
44%
8%
5.5%
50%
31%
56%
208%
1%
18%
All nutrients comparison - raw data values
Nutrient
DV% diff.
Vitamin B12
8.94µg
1.66µg
303%
Iron
2.92mg
0.32mg
33%
Polyunsaturated fat
5.148g
0.59g
30%
Calcium
382mg
91mg
29%
Sodium
307mg
947mg
28%
Phosphorus
490mg
306mg
26%
Vitamin D*
193 IU
4 IU
24%
Vitamin D
4.8µg
0.1µg
24%
Cholesterol
142mg
211mg
23%
Vitamin B2
0.227mg
0.024mg
16%
Vitamin B3
5.245mg
2.678mg
16%
Fats
11.45g
1.7g
15%
Choline
75mg
135.4mg
11%
Monounsaturated fat
3.869g
0.361g
9%
Copper
0.186mg
0.258mg
8%
Potassium
397mg
170mg
7%
Vitamin A
32µg
90µg
6%
Selenium
52.7µg
49.5µg
6%
Vitamin B6
0.167mg
0.242mg
6%
Saturated fat
1.528g
0.521g
5%
Calories
208kcal
119kcal
4%
Protein
24.62g
22.78g
4%
Vitamin B1
0.08mg
0.032mg
4%
Folate
10µg
24µg
4%
Zinc
1.31mg
1.63mg
3%
Manganese
0.108mg
0.049mg
3%
Vitamin B5
0.642mg
0.519mg
2%
Vitamin K
2.6µg
0.4µg
2%
Carbs
0g
1.52g
1%
Vitamin E
2.04mg
2.2mg
1%
Protein per 100 calories
12g
19g
N/A
Calories per 10 g protein
84kcal
52kcal
N/A
Weight per 100 calories
48g
84g
N/A
Unsaturated / Saturated Fat ratio
5.9
1.8
N/A
Net carbs
0g
1.52g
N/A
Magnesium
39mg
37mg
0%
Trans fat
0.035g
N/A
Tryptophan
0.276mg
0.26mg
0%
Threonine
1.079mg
0.904mg
0%
Isoleucine
1.134mg
1.05mg
0%
Leucine
2.001mg
1.95mg
0%
Lysine
2.26mg
2.172mg
0%
Methionine
0.729mg
0.665mg
0%
Phenylalanine
0.961mg
0.992mg
0%
Valine
1.268mg
1.067mg
0%
Histidine
0.725mg
0.501mg
0%
Omega-3 - EPA
0.473g
0.135g
N/A
Omega-3 - DHA
0.509g
0.141g
N/A
Omega-3 - DPA
0g
0.012g
N/A
Omega-6 - Eicosadienoic acid
0.012g
N/A
Macronutrient Comparison
Macronutrient breakdown side-by-side comparison
3
25%
11%
60%
4%
Protein:
24.62 g
Fats:
11.45 g
Carbs:
0 g
Water:
59.61 g
Other:
4.32 g
2
23%
2%
72%
2%
Protein:
22.78 g
Fats:
1.7 g
Carbs:
1.52 g
Water:
71.56 g
Other:
2.44 g
Contains
more
Fats Fats
+573.5%
Contains
more
Other Other
+77%
Contains
more
Carbs Carbs
+∞%
Contains
more
Water Water
+20%
~equal in
Protein
~22.78g
Fat Type Comparison
Fat type breakdown side-by-side comparison
2
14%
37%
49%
Saturated fat:
Sat. Fat
1.528 g
Monounsaturated fat:
Mono. Fat
3.869 g
Polyunsaturated fat:
Poly. Fat
5.148 g
1
35%
25%
40%
Saturated fat:
Sat. Fat
0.521 g
Monounsaturated fat:
Mono. Fat
0.361 g
Polyunsaturated fat:
Poly. Fat
0.59 g
Contains
more
Mono. Fat Monounsaturated fat
+971.7%
Contains
more
Poly. Fat Polyunsaturated fat
+772.5%
Contains
less
Sat. Fat Saturated fat
-65.9%