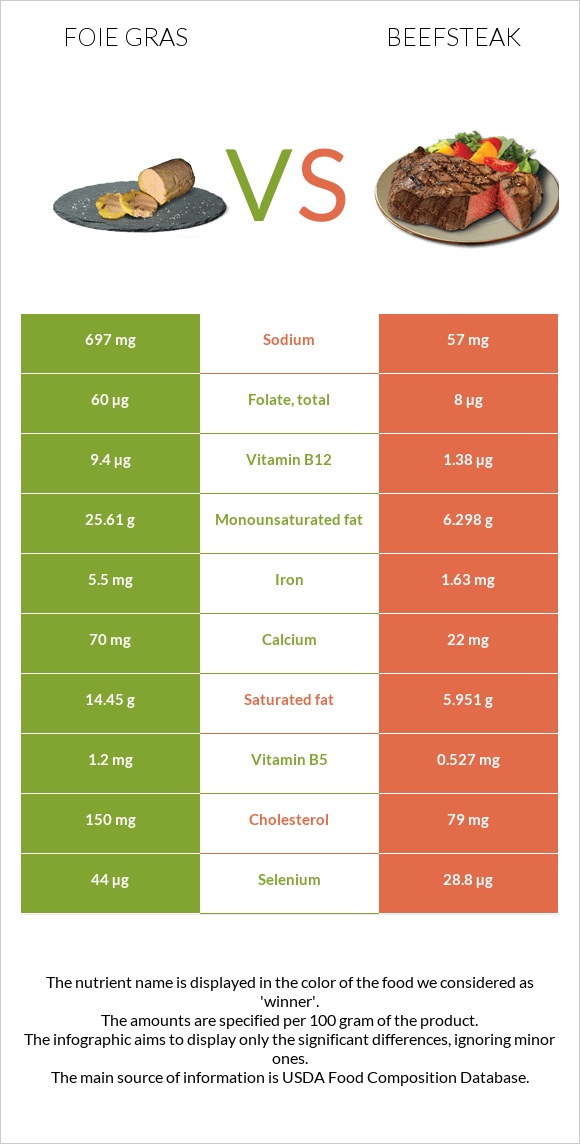
What are the main differences between foie gras and beefsteak? Foie gras is richer in vitamin B12, vitamin A, iron, copper, and selenium, yet beefsteak is richer in vitamin B6, zinc, and vitamin B3. Foie gras's daily need coverage for vitamin B12 is 334% higher. Beefsteak contains less sodium. We used Pate de foie gras, canned (goose liver pate), smoked and Beef, loin, top loin, separable lean, and fat, trimmed to 1/8" fat, select, cooked, grilled types in this comparison.
Infographic
Mineral Comparison
Mineral comparison score is based on the number of minerals by which one or the other food is richer. The "coverage" charts below show how much of the daily needs can be covered by 300 grams of the food.
5
100 g
300 g
1 tbsp - 13g 1 oz - 28.35g
Magnesium
Magnesium
Calcium
Calcium
Potassium
Potassium
Iron
Iron
Copper
Copper
Zinc
Zinc
Phosphorus
Phosphorus
Sodium
Sodium
Manganese
Manganese
Selenium
Selenium
9.3%
21%
12%
206%
133%
25%
86%
91%
16%
240%
4
100 g
300 g
3 oz - 85g
Magnesium
Magnesium
Calcium
Calcium
Potassium
Potassium
Iron
Iron
Copper
Copper
Zinc
Zinc
Phosphorus
Phosphorus
Sodium
Sodium
Manganese
Manganese
Selenium
Selenium
16%
6.6%
30%
61%
24%
132%
91%
7.4%
1.2%
157%
Vitamin Comparison
Vitamin comparison score is based on the number of vitamins by which one or the other food is richer. The "coverage" charts below show how much of the daily needs can be covered by 300 grams of the food.
7
100 g
300 g
1 tbsp - 13g 1 oz - 28.35g
Vitamin C
Vit. C
Vitamin D
Vit. D
Vitamin A
Vit. A
Vitamin E
Vit. E
Vitamin B1
Vit. B1
Vitamin B2
Vit. B2
Vitamin B3
Vit. B3
Vitamin B5
Vit. B5
Vitamin B6
Vit. B6
Vitamin B12
Vit. B12
Vitamin K
Vit. K
Folate
Folate
6.7%
0%
334%
0%
22%
69%
47%
72%
14%
1175%
0%
45%
4
100 g
300 g
3 oz - 85g
Vitamin C
Vit. C
Vitamin D
Vit. D
Vitamin A
Vit. A
Vitamin E
Vit. E
Vitamin B1
Vit. B1
Vitamin B2
Vit. B2
Vitamin B3
Vit. B3
Vitamin B5
Vit. B5
Vitamin B6
Vit. B6
Vitamin B12
Vit. B12
Vitamin K
Vit. K
Folate
Folate
0%
0%
0%
9%
20%
32%
131%
32%
135%
173%
4%
6%
All nutrients comparison - raw data values
Nutrient
DV% diff.
Vitamin B12
9.4µg
1.38µg
334%
Vitamin A
1001µg
0µg
111%
Iron
5.5mg
1.63mg
48%
Monounsaturated fat
25.61g
6.298g
48%
Fats
43.84g
15.11g
44%
Vitamin B6
0.06mg
0.585mg
40%
Saturated fat
14.45g
5.951g
39%
Copper
0.4mg
0.073mg
36%
Zinc
0.92mg
4.85mg
36%
Protein
11.4g
26.72g
31%
Sodium
697mg
57mg
28%
Selenium
44µg
28.8µg
28%
Vitamin B3
2.51mg
6.978mg
28%
Cholesterol
150mg
79mg
24%
Choline
101.8mg
19%
Vitamin B5
1.2mg
0.527mg
13%
Folate
60µg
8µg
13%
Vitamin B2
0.299mg
0.14mg
12%
Calories
462kcal
250kcal
11%
Potassium
138mg
340mg
6%
Calcium
70mg
22mg
5%
Manganese
0.12mg
0.009mg
5%
Vitamin E
0.45mg
3%
Vitamin C
2mg
0mg
2%
Carbs
4.67g
0g
2%
Magnesium
13mg
23mg
2%
Phosphorus
200mg
213mg
2%
Polyunsaturated fat
0.84g
0.56g
2%
Vitamin B1
0.088mg
0.078mg
1%
Vitamin K
1.6µg
1%
Protein per 100 calories
2.5g
11g
N/A
Calories per 10 g protein
405kcal
94kcal
N/A
Weight per 100 calories
22g
40g
N/A
Unsaturated / Saturated Fat ratio
1.8
1.2
N/A
Net carbs
4.67g
0g
N/A
Tryptophan
0.161mg
0.173mg
0%
Threonine
0.507mg
1.054mg
0%
Isoleucine
0.606mg
1.201mg
0%
Leucine
1.029mg
2.099mg
0%
Lysine
0.863mg
2.23mg
0%
Methionine
0.27mg
0.687mg
0%
Phenylalanine
0.567mg
1.042mg
0%
Valine
0.719mg
1.309mg
0%
Histidine
0.303mg
0.842mg
0%
Macronutrient Comparison
Macronutrient breakdown side-by-side comparison
3
11%
44%
5%
37%
3%
Protein:
11.4 g
Fats:
43.84 g
Carbs:
4.67 g
Water:
37.04 g
Other:
3.05 g
2
27%
15%
58%
Protein:
26.72 g
Fats:
15.11 g
Carbs:
0 g
Water:
57.96 g
Other:
0.21 g
Contains
more
Fats Fats
+190.1%
Contains
more
Carbs Carbs
+∞%
Contains
more
Other Other
+1352.4%
Contains
more
Protein Protein
+134.4%
Contains
more
Water Water
+56.5%
Fat Type Comparison
Fat type breakdown side-by-side comparison
2
35%
63%
2%
Saturated fat:
Sat. Fat
14.45 g
Monounsaturated fat:
Mono. Fat
25.61 g
Polyunsaturated fat:
Poly. Fat
0.84 g
1
46%
49%
4%
Saturated fat:
Sat. Fat
5.951 g
Monounsaturated fat:
Mono. Fat
6.298 g
Polyunsaturated fat:
Poly. Fat
0.56 g
Contains
more
Mono. Fat Monounsaturated fat
+306.6%
Contains
more
Poly. Fat Polyunsaturated fat
+50%
Contains
less
Sat. Fat Saturated fat
-58.8%