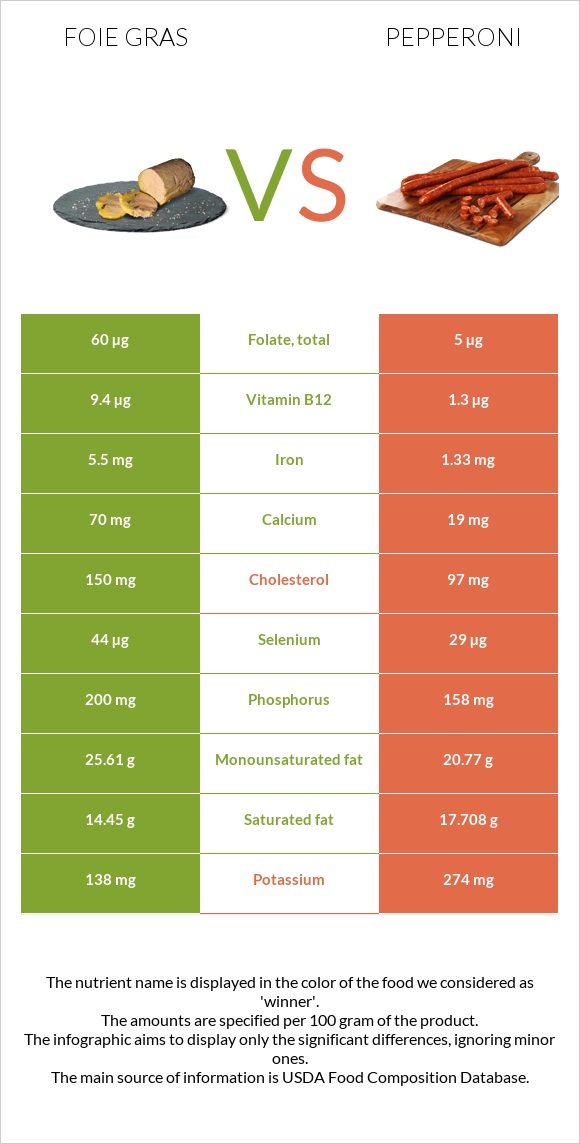
How are foie gras and pepperoni different? Foie gras is higher in vitamin B12, vitamin A, iron, copper, and selenium; however, pepperoni is richer in manganese and vitamin B6. Daily need coverage for vitamin B12 for foie gras is 338% higher. Pepperoni has less cholesterol. Pate de foie gras, canned (goose liver pate), smoked and Pepperoni, beef, and pork, sliced are the varieties used in this article.
Infographic
Mineral Comparison
Mineral comparison score is based on the number of minerals by which one or the other food is richer. The "coverage" charts below show how much of the daily needs can be covered by 300 grams of the food.
6
100 g
300 g
1 tbsp - 13g 1 oz - 28.35g
Magnesium
Magnesium
Calcium
Calcium
Potassium
Potassium
Iron
Iron
Copper
Copper
Zinc
Zinc
Phosphorus
Phosphorus
Sodium
Sodium
Manganese
Manganese
Selenium
Selenium
9.3%
21%
12%
206%
133%
25%
86%
91%
16%
240%
4
100 g
300 g
1 piece - 2g 1 oz - 28g 3 oz - 85g
Magnesium
Magnesium
Calcium
Calcium
Potassium
Potassium
Iron
Iron
Copper
Copper
Zinc
Zinc
Phosphorus
Phosphorus
Sodium
Sodium
Manganese
Manganese
Selenium
Selenium
13%
5.7%
24%
50%
30%
67%
68%
206%
140%
158%
Vitamin Comparison
Vitamin comparison score is based on the number of vitamins by which one or the other food is richer. The "coverage" charts below show how much of the daily needs can be covered by 300 grams of the food.
6
100 g
300 g
1 tbsp - 13g 1 oz - 28.35g
Vitamin C
Vit. C
Vitamin D
Vit. D
Vitamin A
Vit. A
Vitamin E
Vit. E
Vitamin B1
Vit. B1
Vitamin B2
Vit. B2
Vitamin B3
Vit. B3
Vitamin B5
Vit. B5
Vitamin B6
Vit. B6
Vitamin B12
Vit. B12
Vitamin K
Vit. K
Folate
Folate
6.7%
0%
334%
0%
22%
69%
47%
72%
14%
1175%
0%
45%
6
100 g
300 g
1 piece - 2g 1 oz - 28g 3 oz - 85g
Vitamin C
Vit. C
Vitamin D
Vit. D
Vitamin A
Vit. A
Vitamin E
Vit. E
Vitamin B1
Vit. B1
Vitamin B2
Vit. B2
Vitamin B3
Vit. B3
Vitamin B5
Vit. B5
Vitamin B6
Vit. B6
Vitamin B12
Vit. B12
Vitamin K
Vit. K
Folate
Folate
0%
20%
0%
21%
68%
59%
94%
56%
84%
163%
15%
3.8%
All nutrients comparison - raw data values
Nutrient
DV% diff.
Vitamin B12
9.4µg
1.3µg
338%
Vitamin A
1001µg
0µg
111%
Iron
5.5mg
1.33mg
52%
Manganese
0.12mg
1.074mg
41%
Sodium
697mg
1582mg
38%
Copper
0.4mg
0.091mg
34%
Selenium
44µg
29µg
27%
Polyunsaturated fat
0.84g
4.458g
24%
Vitamin B6
0.06mg
0.362mg
23%
Cholesterol
150mg
97mg
18%
Protein
11.4g
19.25g
16%
Vitamin B1
0.088mg
0.271mg
15%
Vitamin B3
2.51mg
4.987mg
15%
Saturated fat
14.45g
17.708g
15%
Zinc
0.92mg
2.44mg
14%
Folate
60µg
5µg
14%
Monounsaturated fat
25.61g
20.77g
12%
Choline
51.2mg
9%
Vitamin D*
52 IU
7%
Vitamin D
1.3µg
7%
Vitamin E
1.03mg
7%
Phosphorus
200mg
158mg
6%
Calcium
70mg
19mg
5%
Vitamin B5
1.2mg
0.93mg
5%
Vitamin K
5.8µg
5%
Fats
43.84g
46.28g
4%
Potassium
138mg
274mg
4%
Vitamin B2
0.299mg
0.257mg
3%
Calories
462kcal
504kcal
2%
Vitamin C
2mg
0mg
2%
Carbs
4.67g
1.18g
1%
Magnesium
13mg
18mg
1%
Protein per 100 calories
2.5g
3.8g
N/A
Calories per 10 g protein
405kcal
262kcal
N/A
Weight per 100 calories
22g
20g
N/A
Unsaturated / Saturated Fat ratio
1.8
1.4
N/A
Net carbs
4.67g
1.18g
N/A
Trans fat
1.527g
N/A
Tryptophan
0.161mg
0.23mg
0%
Threonine
0.507mg
0.869mg
0%
Isoleucine
0.606mg
0.901mg
0%
Leucine
1.029mg
1.575mg
0%
Lysine
0.863mg
1.652mg
0%
Methionine
0.27mg
0.511mg
0%
Phenylalanine
0.567mg
0.778mg
0%
Valine
0.719mg
0.987mg
0%
Histidine
0.303mg
0.688mg
0%
Omega-3 - EPA
0g
0.004g
N/A
Omega-3 - DHA
0g
0.004g
N/A
Omega-3 - ALA
0.164g
N/A
Omega-3 - DPA
0g
0.02g
N/A
Omega-3 - Eicosatrienoic acid
0.018g
N/A
Omega-6 - Gamma-linoleic acid
0.002g
N/A
Omega-6 - Dihomo-gamma-linoleic acid
0.04g
N/A
Omega-6 - Eicosadienoic acid
0.136g
N/A
Omega-6 - Linoleic acid
3.605g
N/A
Macronutrient Comparison
Macronutrient breakdown side-by-side comparison
2
11%
44%
5%
37%
3%
Protein:
11.4 g
Fats:
43.84 g
Carbs:
4.67 g
Water:
37.04 g
Other:
3.05 g
3
19%
46%
29%
5%
Protein:
19.25 g
Fats:
46.28 g
Carbs:
1.18 g
Water:
28.55 g
Other:
4.74 g
Contains
more
Carbs Carbs
+295.8%
Contains
more
Water Water
+29.7%
Contains
more
Protein Protein
+68.9%
Contains
more
Other Other
+55.4%
Fat Type Comparison
Fat type breakdown side-by-side comparison
2
35%
63%
2%
Saturated fat:
Sat. Fat
14.45 g
Monounsaturated fat:
Mono. Fat
25.61 g
Polyunsaturated fat:
Poly. Fat
0.84 g
1
41%
48%
10%
Saturated fat:
Sat. Fat
17.708 g
Monounsaturated fat:
Mono. Fat
20.77 g
Polyunsaturated fat:
Poly. Fat
4.458 g
Contains
less
Sat. Fat Saturated fat
-18.4%
Contains
more
Mono. Fat Monounsaturated fat
+23.3%
Contains
more
Poly. Fat Polyunsaturated fat
+430.7%